OVERVIEW
Stocktwits Crypto Data Dive - Week 37
Welcome to the Stocktwits Crypto Data Dive for Week 37 of 2026! 📊
In this issue, we'll dive into the data to keep you informed about the progress of the overall crypto market and shine a spotlight on emerging and established trends.
What You’ll Find In The Stocktwits Crypto Data Dive has three main objectives:
Total and Altcoin caps, stamped with YTD moves and the gap to ATH.
Seven-layer market-cap recap (TMC ex-stables, ex-top-50, and five more flavors).
Crypto Index Performance covering 12 indices.
The Liquidation Station boards the train with 30-day totals plus a 7-day heatmap for maximum schadenfreude.
Market Heatmap, Social Volume Heatmap, Active Address Heatmap.
ETF scorecards for BTC and ETH still tracking 7- and 30-day flows.
So, without further delay, let's jump right into the data from week 37 and explore its intriguing insights! 🚀
CRYPTO
Crypto Market Cap Update
What is the broader trend within the crypto market? The simplest way to track this is by using three market cap charts. So let's see what we got. 🔭
*the price levels and performance values may be very different from what you read in your mailbox vs. what's happening in the live market. This is especially true when crypto faces a new bull or bear run.
Total Market Cap
All-Time High Close: $4.22 trillion
YTD: -12%
From ATH: -39%

Click to enlarge.
Altcoin Market Cap
All-Time High: $1.73 trillion
YTD: -13%
From ATH: -40%

Click to enlarge.
CRYPTOTWITS
Missed An Issue This Week? I Got Ya Right Here 👇
Here’s this week’s Cryptotwits newsletters. That you probably read already. Maybe. Probably.
Monday - Labor Day
Tuesday - Please Hold. Your Anxiety Is Important to Us. 😰
Wednesday - The Good News Is We're Stuck ↔️
Friday - 🎵 Forward Press With Heart Unfailing 🎵
CRYPTO
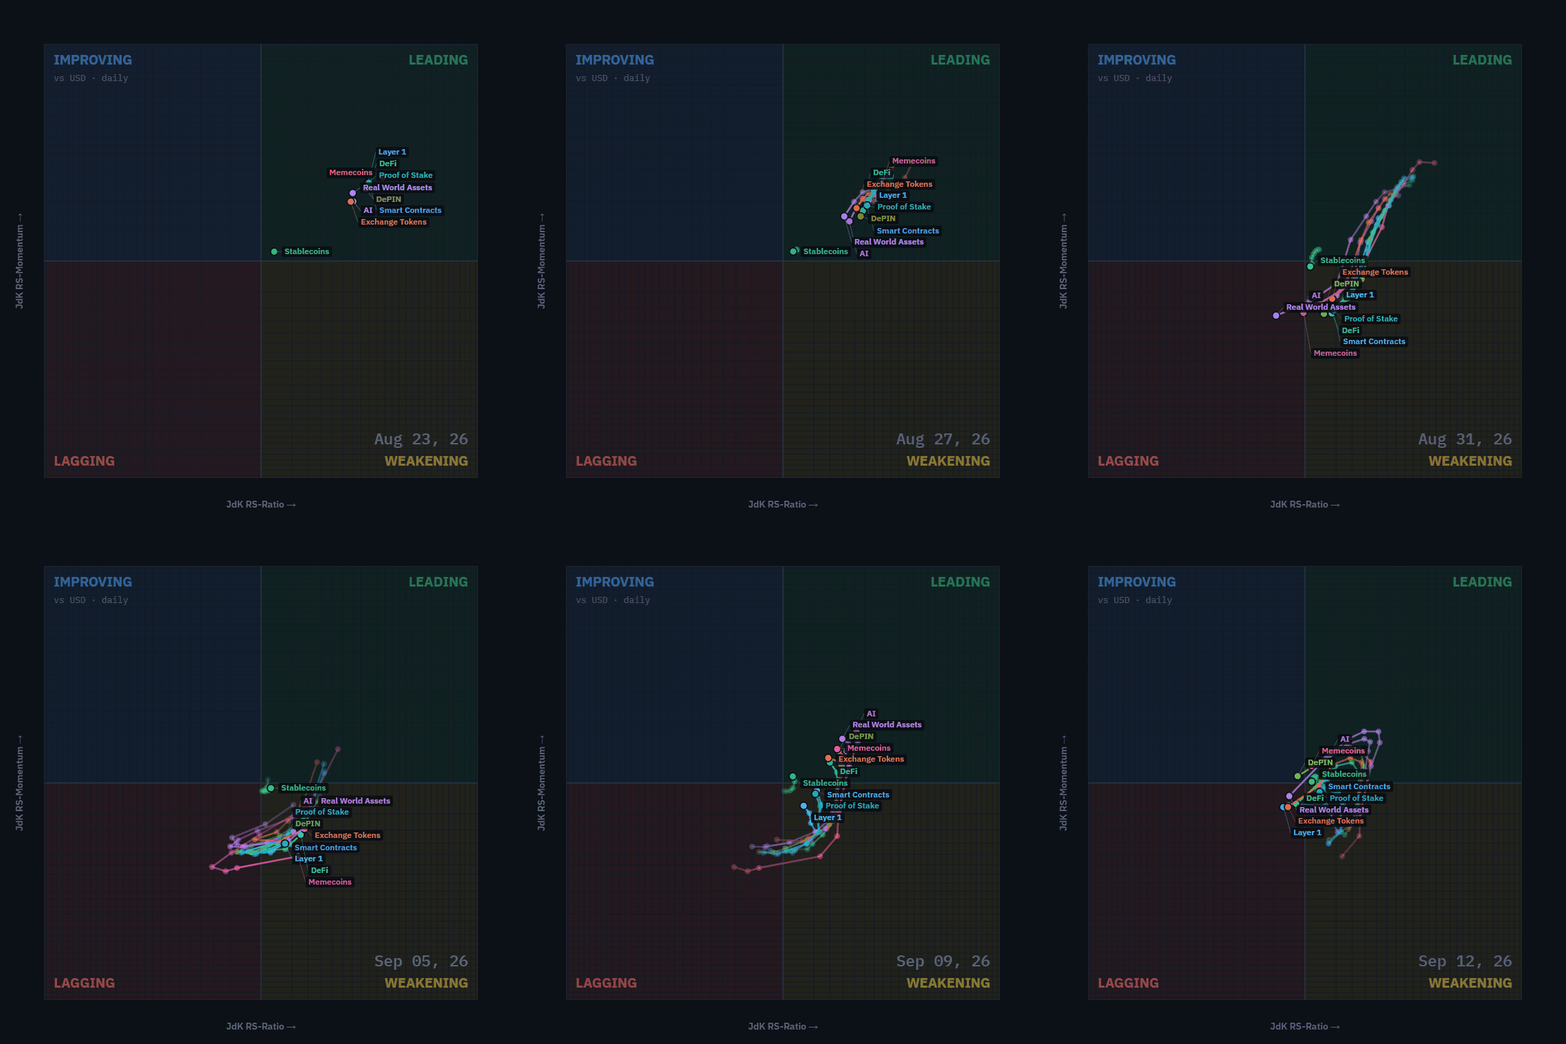
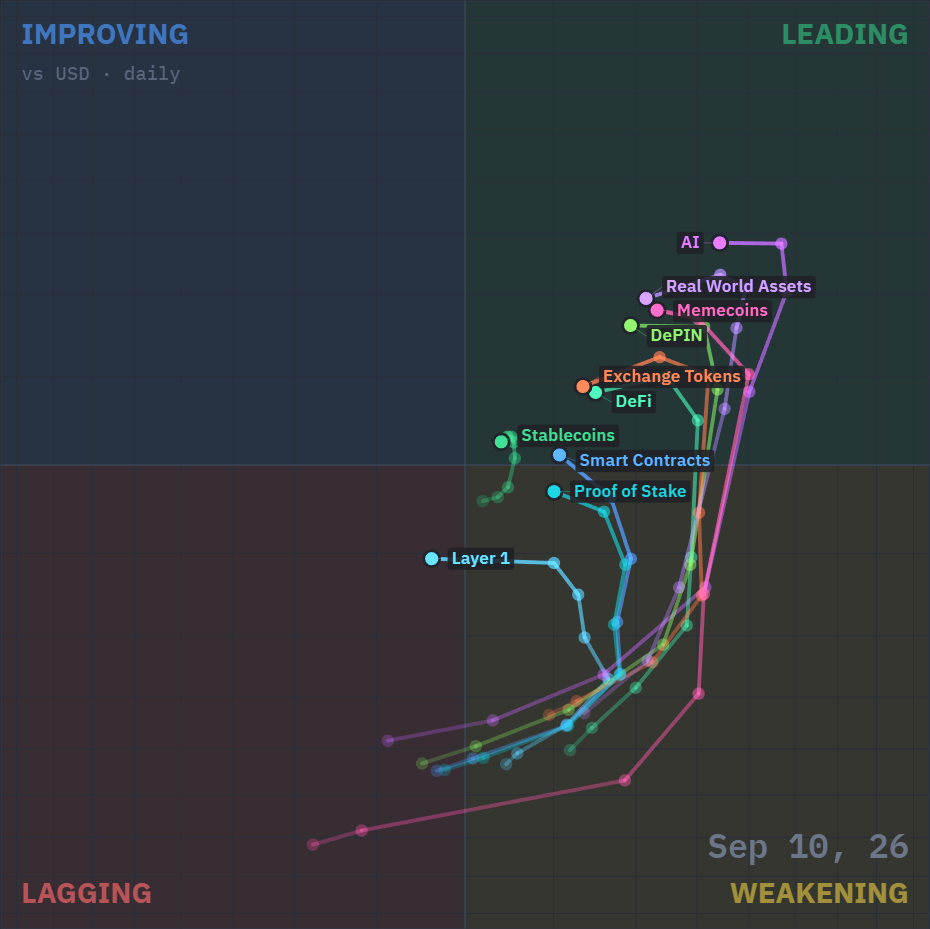
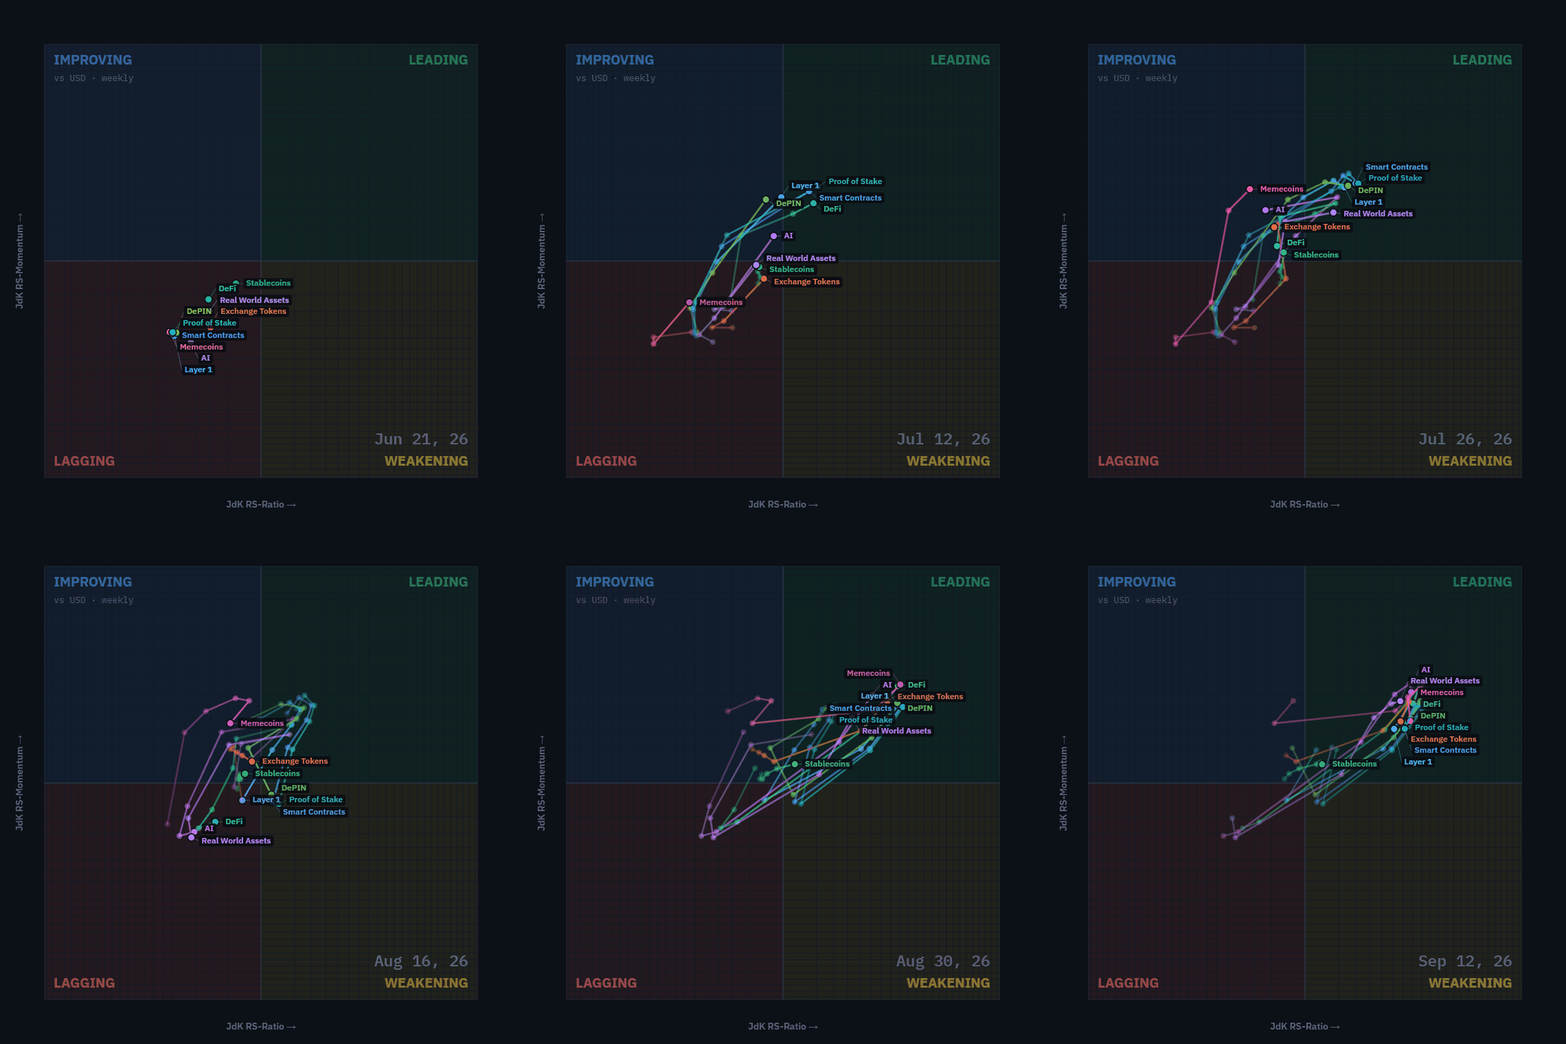
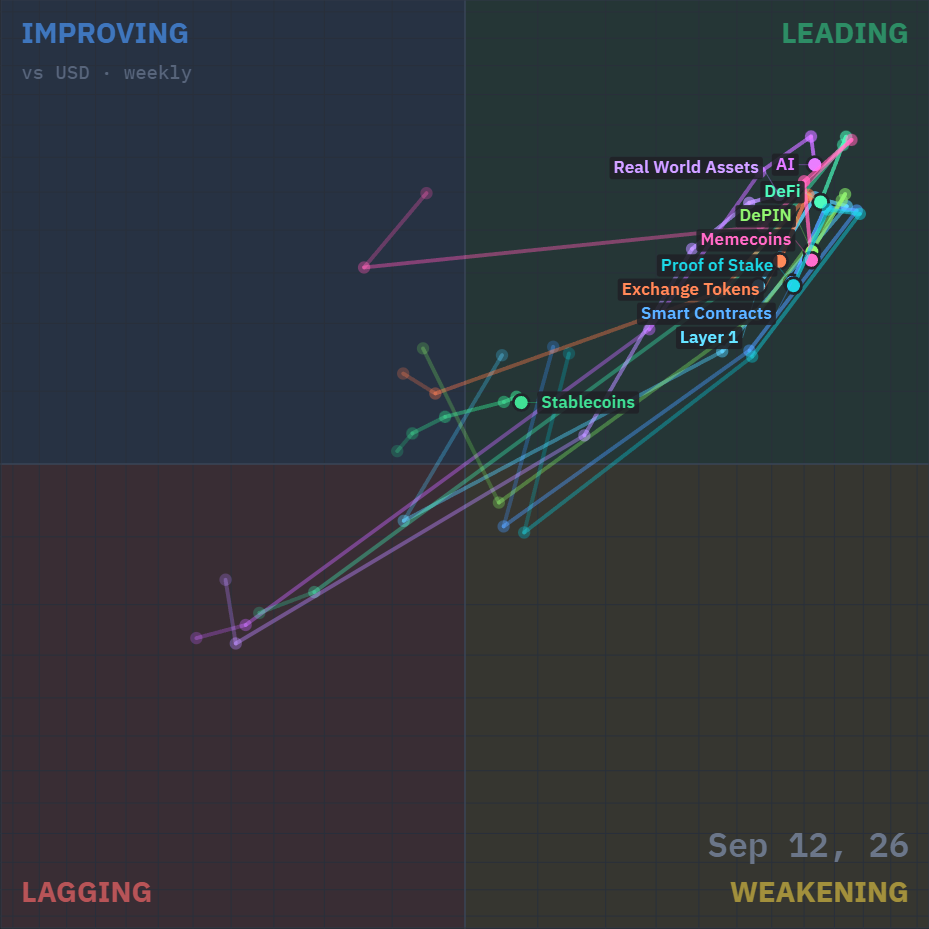
Stocktwits Crypto Index RRG
Relative Rotation Graphs (RRG) help us visualize how a currency or sector performs compared to a benchmark - in this case, the U.S. Dollar Index (DXY). Think of the four colored sectors as stages in a race:
Leading Quadrant (green) - You're a champ! 🏆 You're ahead of everyone else, and the crowd is cheering. But watch out; you might be overdoing it.
Weakening Quadrant (yellow) - You're slowing down 😓 and losing your lead. Maybe you're a bit demoralized because your biggest fan didn't show up. You're now in the middle of the pack.
Lagging Quadrant (red) - Disaster strikes! 😱 You're injured, exhausted, or just made a big mistake. You're now in last place, and it's a sad scene.
Improving Quadrant (blue) - Time for a comeback! 💪 Your motivation returns, the music swells, and you're picking up speed. You're back in the middle, catching up with the leaders.
Analyzing the RRG Examples
Example 1: Rapid Rotation
- If an instrument moves quickly through all four quadrants, it could indicate high volatility or erratic behavior. Traders may want to be cautious or use appropriate risk management strategies in such cases.
Example 2: Stuck in the Middle
- An instrument that remains close to the center of the RRG might be in a consolidation phase, lacking a clear trend or momentum. Traders might wait for a decisive move before entering a position.
Example 3: Consistent Leader
- If an instrument stays in the Leading Quadrant (top right) for an extended period, it could signify a strong, sustained uptrend. Traders might consider buying opportunities or riding the trend.
Example 4: Slow Recovery
- An instrument that gradually moves from the Lagging Quadrant (bottom left) to the Improving Quadrant (blue) and eventually to the Leading Quadrant (green) could indicate a slow but steady recovery. Traders might look for potential reversal or bottom-fishing opportunities.
The GIF below shows the past 21 days of movement on the RRG.
The GIF below shows the past 13 weeks of movement on the RRG.
EDITORS PICK
1M+ traders get the market's pops, drops, and what's next by 7PM ET every day. Free.

Over 1M traders read this market recap before dinner. Here's why.
Every weekday at 7PM ET, over a million traders get The Daily Rip: the only market recap that tells you what moved, what mattered, and what's next. No fluff, no filler, no Bloomberg terminal required. Stock moves, earnings, and the macro that actually matters, plus the pops and drops you'll be talking about tomorrow. It's markets explained like a smart friend over beers, not a lecture. Free, every trading day, in under 10 minutes. Made by Stocktwits, home to millions of retail investors.
CRYPTO
Weekly Total Market Cap (TMC) Performance
Index | Value | Weekly Performance |
|---|---|---|
TMC Excluding BTC and ETH | $760B | 0% |
TMC Excluding BTC and Stablecoins | $784B | +1% |
TMC Excluding BTC, ETH, and Stablecoins | $478B | 0% |
TMC Excluding Stablecoins | $2.34T | 0% |
TMC Excluding Top 10 | $203B | +1% |
TMC Excluding Top 50 | $42B | +2% |
TMC Excluding Top 100 | $6.8B | 0% |
CRYPTO
Weekly Crypto Index Performance
Index | Weekly Performance |
|---|---|
AI | +3% |
Decentralized Finance | -3% |
Decentralized Physical Infrastructure | -2% |
Exchange Tokens | -3% |
Layer 1 | -5% |
Meme | -4% |
Proof-Of-Stake | -2% |
Proof-Of-Work | -5% |
Real World Asset Tokenization | -2% |
Rehypothecated | -3% |
Smart Contracts | -2% |
Stablecoins | 0% |
CRYPTO
Liquidation Station 😱
Interested in how much has been flushed out of leveraged long and short positions? Who’s getting hurt the most? This is the best place to get an idea of how leveraged positions are doing. 🔴
30-day Total Liquidations 📆
What You’re Looking At
Green bars above zero = longs blown out because price fell.
Red bars below zero = shorts blown out because price ripped.
Left-hand scale is U.S. dollars (millions); the dashed line near the top sits at $1B.

30-day Total Crypto Liquidation Chart - Click to enlarge.
August 17 - August 18 - BTC breaks higher and August 18 wipes out $2.739B in shorts, easily the largest liquidation event of the window.
August 19 - Follow-through short liquidations remain heavy at roughly $600M-$700M as BTC continues climbing.
August 20 - Shorts take another roughly $1.2B-$1.3B hit. At this point the bearish thesis was less a trade and more a charitable contribution.
August 21 - Longs finally get clipped, with roughly $700M-$800M liquidated as the breakout retraces and late buyers discover entries still matter.
September 2 - Another short-side wipe around $450M-$500M as BTC pushes against the upper portion of its new range.
September 9 - September 10 - Two-sided activity picks back up, with long liquidations around $300M-$400M before shorts take roughly another $400M-$500M hit.
Quick read
What You’re Looking At
Rows = coins, columns = timestamps.
Color = head-count of forced liquidations (legend tops at 2,000).
A cell showing “BTC 1,600” means 1,600 separate BTC positions were liquidated.

Weekly Crypto Liquidation History Heatmap - Click to enlarge.
September 5 20:00 - ETH and ZEC push toward the upper end of the scale, while BTC and SOL also show elevated counts. First broad majors-led flare of the week.
September 7 04:00 - BTC and ETH heat up together, with SOL following and ZEC remaining active. Roughly 1,500-2,000 liquidations appear in the hottest cells.
September 8 12:00 - Another synchronized majors burst. BTC and ETH run orange while SOL, XRP, and ZEC pick up behind them.
September 9 04:00 - Broad participation expands across the upper rows, with BTC, ETH, SOL, XRP, and ZEC all active. Majors first. Everyone else discovers the meeting five minutes later.
September 10 12:00 - One of the stronger late-week columns, with BTC/ETH elevated and ZEC, SNDK, SUI, ENA, and PUMP showing secondary heat.
September 10 late session - Intensity begins backing off across much of the board after several repeated high-count windows.
Some Interesting Insights 👓
The monthly chart is still owned by August 18 and its $2.739B short wipe. Nothing else is close.
Both sides eventually got hit, but shorts absorbed the overwhelming majority of the extreme notional damage.
The weekly heat-map shows liquidation participation remained elevated even after daily dollar totals normalized.
BTC, ETH, and SOL continue to lead the liquidation cycle, with ZEC and a handful of higher-beta names amplifying individual bursts.
Early-warning rule: when daily liquidation dollars look ordinary again but the heat-map keeps hitting orange, leverage has rebuilt faster than the monthly bars make it seem.
|
Get the app Real-time alerts, live earnings calls, your personalised feed - the best experience is on mobile.
|


Get In Touch 📬
Email me, Jonathan Morgan, feedback; I’d love to hear from you. 📧
Follow me on Stocktwits 🫂 And Sponsor this newsletter 😎
Terms & Conditions 📝
Securities Disclaimer: STOCKTWITS IS NOT A TAX ADVISOR, BROKER, FINANCIAL ADVISOR OR INVESTMENT ADVISOR. THE SERVICE IS NOT INTENDED TO PROVIDE TAX, LEGAL, FINANCIAL OR INVESTMENT ADVICE, AND NOTHING ON THE SERVICE SHOULD BE CONSTRUED AS AN OFFER TO SELL, A SOLICITATION OF AN OFFER TO BUY, OR A RECOMMENDATION FOR ANY SECURITY. Trading in such securities can result in immediate and substantial losses of the capital invested. You should only invest risk capital, and not capital required for other purposes. You alone are solely responsible for determining whether any investment, security or strategy, or any other product or service, is appropriate or suitable for you based on your investment objectives and personal and financial situation. You should also consult an attorney or tax professional regarding your specific legal or tax situation. The Content is to be used for informational and entertainment purposes only and the Service does not provide investment advice for any individual. Stocktwits, its affiliates and partners specifically disclaim any and all liability or loss arising out of any action taken in reliance on Content, including but not limited to market value or other loss on the sale or purchase of any company, property, product, service, security, instrument, or any other matter. You understand that an investment in any security is subject to a number of risks, and that discussions of any security published on the Service will not contain a list or description of relevant risk factors. In addition, please note that some of the stocks about which Content is published on the Service have a low market capitalization and/or insufficient public float. Such stocks are subject to more risk than stocks of larger companies, including greater volatility, lower liquidity and less publicly available information. Read the full terms & conditions here. 🔍
Author Disclosure: The author of this newsletter holds positions in AVAX, ADA, PUDGY, WLD, NEAR, INJ, LTC, LINK, ZEC, XLM, and FET. 📋