OVERVIEW
This Feels Like Getting A Raise The Same Day Your Furnace Dies 😐
Here’s What’s Happening 👇
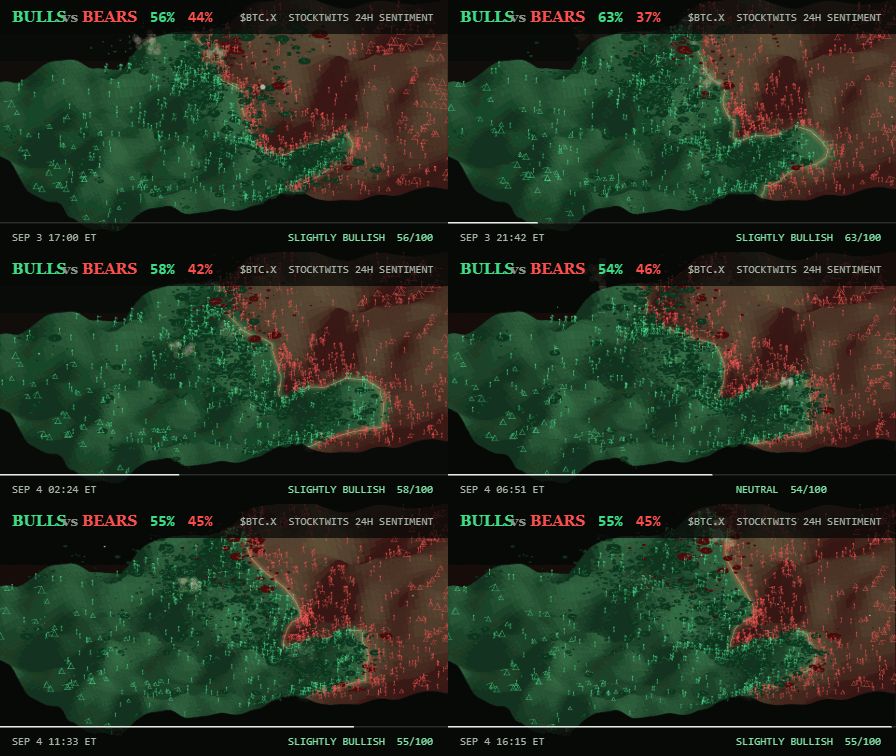
Well, the power went out at my office, and the desktop that has all the pretty tools to make those cool gifs from the Stocktwits data isn’t available. So instead, I used Stocktwits’ MCP to generate the 24 hour battle between bulls and bears. ⚔
But as two stick figure armies.
TECHCNICAL ANALYSIS
Two Week Check Up - Part One 🧑⚕
Back on August 21, I went through some of the major near-term support and resistance levels on AVAX, BTC, XRP, ETH, SOL and SUI. 📆
It’s been 2 weeks. Plenty of time for crypto to either respect the levels, obliterate them, or pretend they never existed like a teenager walking past a sink full of dishes.
So, how’d they do?
Avalanche
On August 21, I had $8 as near-term resistance for $AVAX ( ▼ 1.23% ) and said a move above there would leave a pretty large hole up toward $10.38.

August 21, 2026 AVAXUSD Daily Chart - Click to enlarge.
AVAX closed August 21 at roughly $7.84. The very next day it ripped as high as $8.33. And then promptly got kicked back downstairs.
AVAX closed August 22 around $7.49 and has not closed above $8 since. It spent nearly the entire period stuck between roughly $7.00 and $7.75 and is around $7.50 today.

AVAXUSD Daily Chart - Click to enlarge.
There is also a great, great lesson here with the Ichimoku system: I’ve mentioned before that the Chikou Span responds to the same support/resistance levels - and that’s represented perfectly in the highlighted zone showing the Chikou Span unable to move above the top of the Cloud.
So that $8 value area did exactly what we expected it might do. AVAX technically poked through it intraday, but never confirmed the breakout on a daily close.
The $6.80 support area never got tested either. The closest AVAX got was roughly $7.00. ❄
August 21 Resistance: $8.00
Highest Price Since: $8.33
Confirmed Breakout: Nope
Current Support Zone: $7.30 value area (daily Tenkan-Sen and Kijun-Sen)
Bitcoin
This one was fun.
$BTC ( ▼ 0.45% ) closed August 21 at $78,335, almost dead nuts on the level. It then spent the next week treating $78,400 like one of those doors at a gas station where nobody can figure out if you push or pull. Above it. Below it. Above it again.
BTC finally started getting some cleaner closes north of that area, traded above $81,000 multiple times, and on September 3 reached an intraday high around $82,333.

BTCUSD Daily Chart - Click to enlarge.
Meanwhile, that giant $68,000 to $70,000 support cluster I talked about never came close to being tested. The lowest BTC got after August 21 was roughly $72,500. So $78,400 was less of a brick wall and more of a major pivot. ⌚
August 21 Resistance: $78,400
September 3 High: $82,333
August 21 Support: $70,000
Lowest Price Since: $72,500
Current Support Zone: $78,378 (daily Tenkan-Sen, Monthly Tenkan-Sen)
TECHCNICAL ANALYSIS
Two Week Check Up - Part Two 🧑⚕
XRP
This one didn’t screw around.

August 21, 2026 XRP Daily Chart - Click to enlarge.
I had $1.295 as near-term resistance on August 21, tied to the weekly Kijun-Sen, with $1.20 as support. $XRP ( ▼ 0.74% ) closed August 21 around $1.45, then hit $1.70, the exact level of the Monthly Tenkan Sen, was rejected and went lower.

XRPUSD Daily Chart - Click to enlarge.
More important, after breaking $1.295, XRP never returned to $1.20. Its lowest print since August 21 came on September 2 around $1.31, almost a perfect trip back toward that old $1.295 resistance area without actually touching it.
That’s about as textbook as you can ask for without the market sending a handwritten thank-you card. Old resistance broke. Price expanded. Old resistance then became the neighborhood where buyers started showing up again.
August 21 Resistance: $1.295
Highest Price Since: $1.70
Lowest Recent Price: $1.31
Current Support: $1.40 (daily Tenkan-Sen)
Ethereum

ETHUSD Monthly Chart - Click to enlarge.
There’s not much to say here - it’s stuck. It closed August just below the bottom of the Cloud. And that’s where $ETH ( ▼ 0.34% ) is currently parked. 🅿
ON-CHAIN ANALYTICS
On-Chain Bottom Conditions Scorecard 🗂
Every drawdown produces the same question: is the bottom in? Nobody knows that in advance. So the On-Chain Bottom Conditions Scorecard answers a different one - how much of what past bottoms looked like are showing up right now? 🤔
Six signals, each scored up to 1.00:
Holder Resolve - what share of supply has moved in the past year. When it drops, long-term holders have stopped selling.
Whale Bid - whether the largest wallets are adding coins or shedding them.
Mid-Tier Accumulation - whether serious money and new addresses are showing up or heading out.
Transactional Cheapness - how much value the network moves relative to what holders paid.
Valuation Reset - how far the market trades below what the average holder paid.
Drawdown Depth - how far price sits below the cycle high.
Near 0, nothing resembles a bottom. Near 6, most of it does. Let’s look at some now. 👇
ON-CHAIN ANALYTICS
On-Chain Bottom Conditions Scorecard: Algorand 😶

Click to enlarge.
Holders are 39% underwater and the price sits 85% below the December 2024 high - the structural damage is complete. Wallets holding 1M+ $ALGO ( ▲ 0.32% ) own 9.92 billion coins and have not moved a meaningful amount in two years. 📆
Not buying, not selling, just parked. The 4.29 score comes with an asterisk: only 17 wallets hold $100K+ of ALGO, so that component is three wallets pretending to be a trend. Volume is weak at the 80th percentile.
Slightly bullish, but the participation base is close to nonexistent. 🤷
ON-CHAIN ANALYTICS
On-Chain Bottom Conditions Scorecard: Uniswap 🦄

Click to enlarge.
One-year active supply just hit 62.8%, the lowest since August 2024 - holders have stopped moving coins entirely. The $100K crowd is up 30% on the month and 71% on the quarter, the sharpest sustained build in this window. 🪟
But the whale tier is at its lowest level of the whole stretch and shrinking on every timeframe. And the discount is thinner than the price chart suggests: holders sit 5% underwater, not 40%.
Slightly bullish. Stillness and serious money, without the deep reset. ⛏
ON-CHAIN ANALYTICS
On-Chain Bottom Conditions Scorecard: Cardano 🌽

Click to enlarge.
Wallets holding 1M+ $ADA ( ▼ 1.21% ) own 25.70 billion coins - the most since August 2024, a level set this week, after adding 3.30 billion over two years. 🤯
They're still buying on both the month and the quarter. Holders sit 42% underwater, 83% off the December 2024 high, and the $100K crowd is up 27% on the quarter. The gaps: new wallet creation is at the 17th percentile and network usage is expensive at the 93rd.
Slightly bullish. The best whale bid on the board, no crowd behind it. 🐳
ON-CHAIN ANALYTICS
On-Chain Bottom Conditions Scorecard: XRP 🔢

Click to enlarge.
$XRP ( ▼ 0.74% ) is changing hands cheap relative to activity. The $100K crowd is up 27% on the month, rebuilding from a deep trough. But holders sit essentially at cost basis, about 1% underwater, so the deep-value read isn't there.
Wallets holding 100K+ XRP are at their lowest level of the window after shedding 2.1 billion coins, and holders are still actively moving.
Neutral. Cheap transactions, no discount, no whale bid. 🤌
ON-CHAIN ANALYTICS
On-Chain Bottom Conditions Scorecard: Ethereum 🤖

Click to enlarge.
One-year active supply hit 34.8%, the lowest reading since August 2024. 🚵
Nobody is moving it. The $100K crowd is up 24% on the month and 45% on the quarter. But wallets holding 10K+ ETH are down 7.2 million coins and still shrinking, RVT is at the highest reading of the window, and the market trades 10% above cost basis.
Neutral. Record stillness, a crowd arriving, and no discount to buy into. 🤷
ON-CHAIN ANALYTICS
On-Chain Bottom Conditions Scorecard: Bitcoin 🪙

Click to enlarge.
The market sits 51% above aggregate cost basis - every prior cycle low printed at or below. The drawdown is only 36%. Wallets holding 1K+ BTC are down 691,000 coins since August 2024 and gave back some of their quarterly buying last month. The one bright spot: the $10M+ wallet count is up 11% on the month, rebuilding from the post-October trough. Bearish.
Neutral and about as ‘meh’ as you can get. 😶
Get In Touch 📬
Email me, Jonathan Morgan, feedback; I’d love to hear from you. 📧
Follow me on Stocktwits 🫂 And Sponsor this newsletter 😎
|
Get the app Real-time alerts, live earnings calls, your personalised feed - the best experience is on mobile.
|


Terms & Conditions 📝
Securities Disclaimer: STOCKTWITS IS NOT A TAX ADVISOR, BROKER, FINANCIAL ADVISOR OR INVESTMENT ADVISOR. THE SERVICE IS NOT INTENDED TO PROVIDE TAX, LEGAL, FINANCIAL OR INVESTMENT ADVICE, AND NOTHING ON THE SERVICE SHOULD BE CONSTRUED AS AN OFFER TO SELL, A SOLICITATION OF AN OFFER TO BUY, OR A RECOMMENDATION FOR ANY SECURITY. Trading in such securities can result in immediate and substantial losses of the capital invested. You should only invest risk capital, and not capital required for other purposes. You alone are solely responsible for determining whether any investment, security or strategy, or any other product or service, is appropriate or suitable for you based on your investment objectives and personal and financial situation. You should also consult an attorney or tax professional regarding your specific legal or tax situation. The Content is to be used for informational and entertainment purposes only and the Service does not provide investment advice for any individual. Stocktwits, its affiliates and partners specifically disclaim any and all liability or loss arising out of any action taken in reliance on Content, including but not limited to market value or other loss on the sale or purchase of any company, property, product, service, security, instrument, or any other matter. You understand that an investment in any security is subject to a number of risks, and that discussions of any security published on the Service will not contain a list or description of relevant risk factors. In addition, please note that some of the stocks about which Content is published on the Service have a low market capitalization and/or insufficient public float. Such stocks are subject to more risk than stocks of larger companies, including greater volatility, lower liquidity and less publicly available information. Read the full terms & conditions here. 🔍
Author Disclosure: The author of this newsletter holds positions in AVAX, ADA, PUDGY, WLD, NEAR, INJ, LTC, LINK, ZEC, XLM, and FET. 📋