Sponsored by

OVERVIEW
Green Candles Are My Love Language And Also My Primary Trigger 💚
Here’s What’s Happening 👇
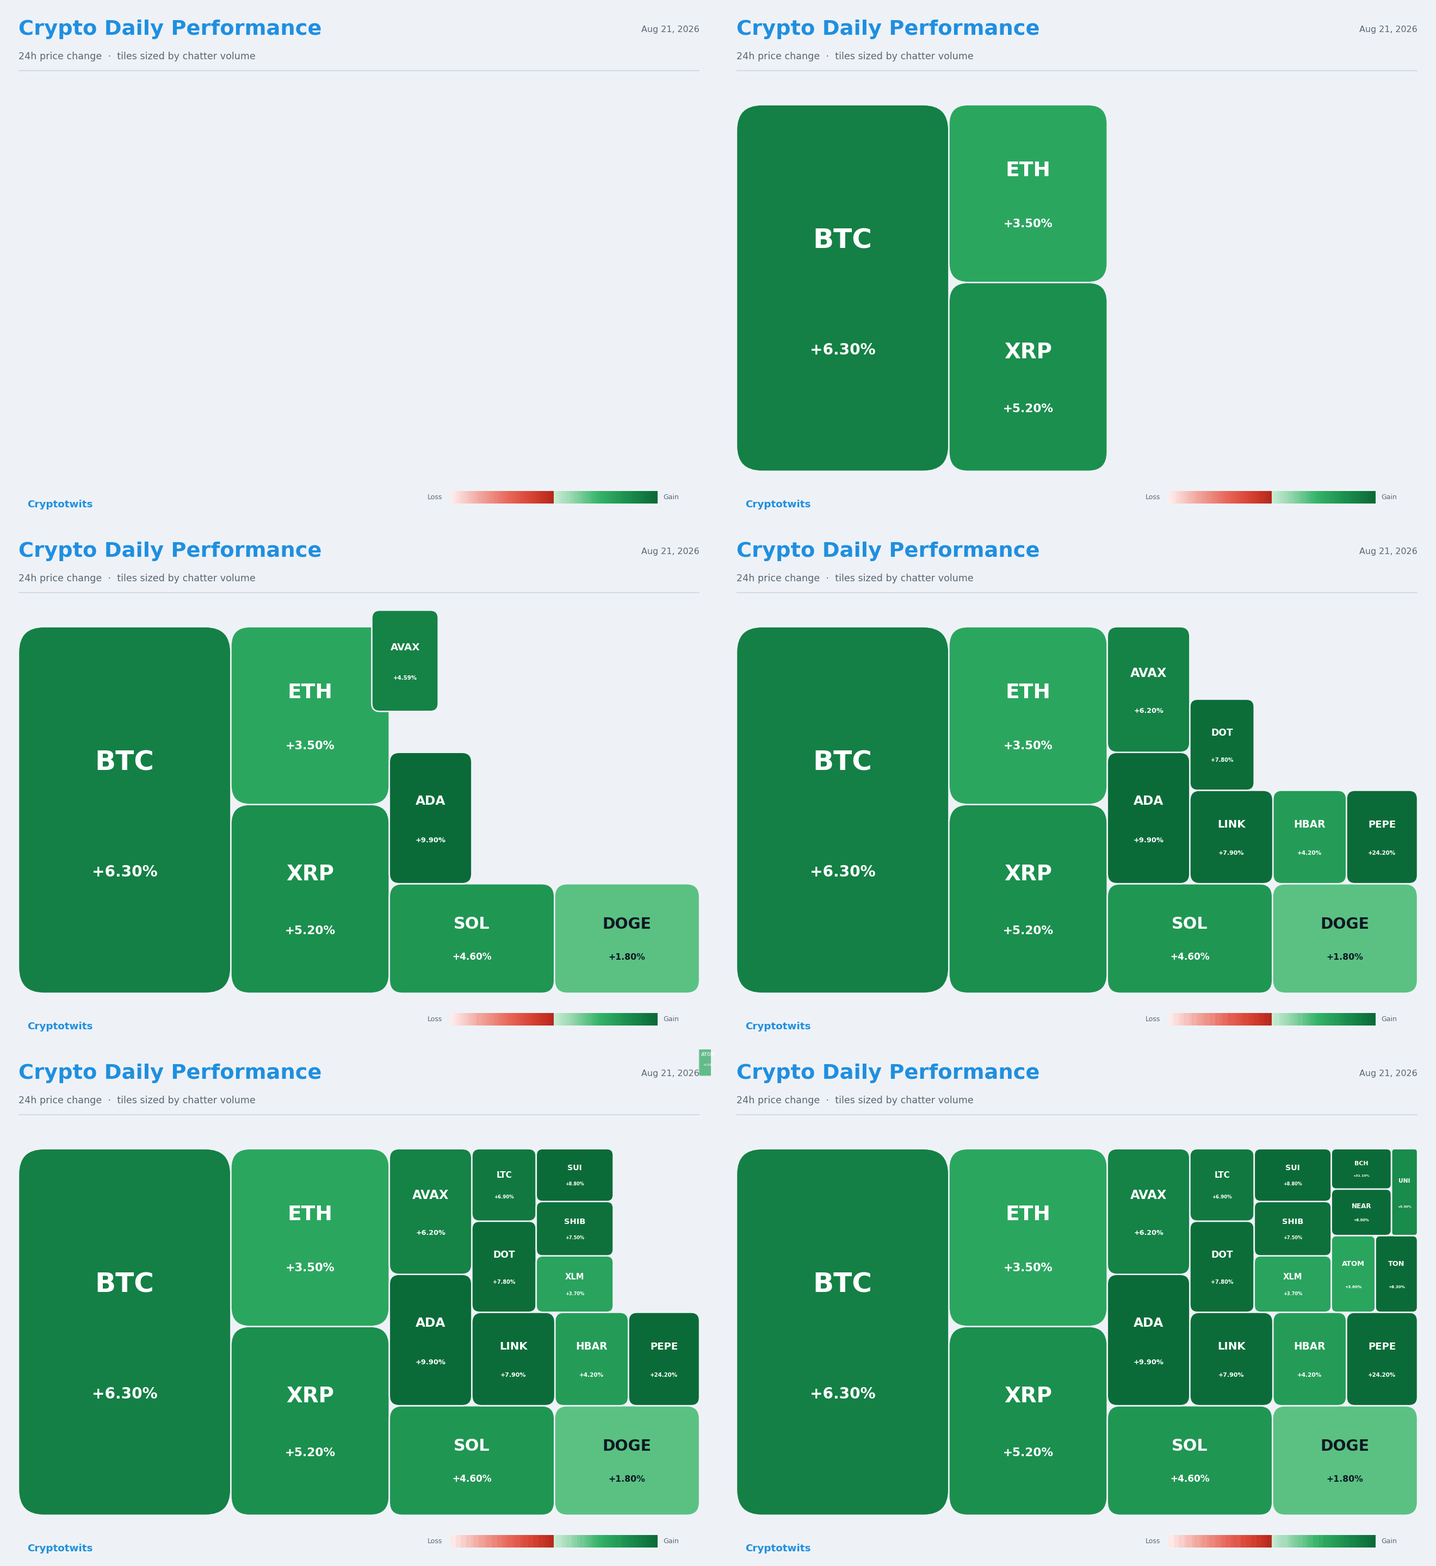
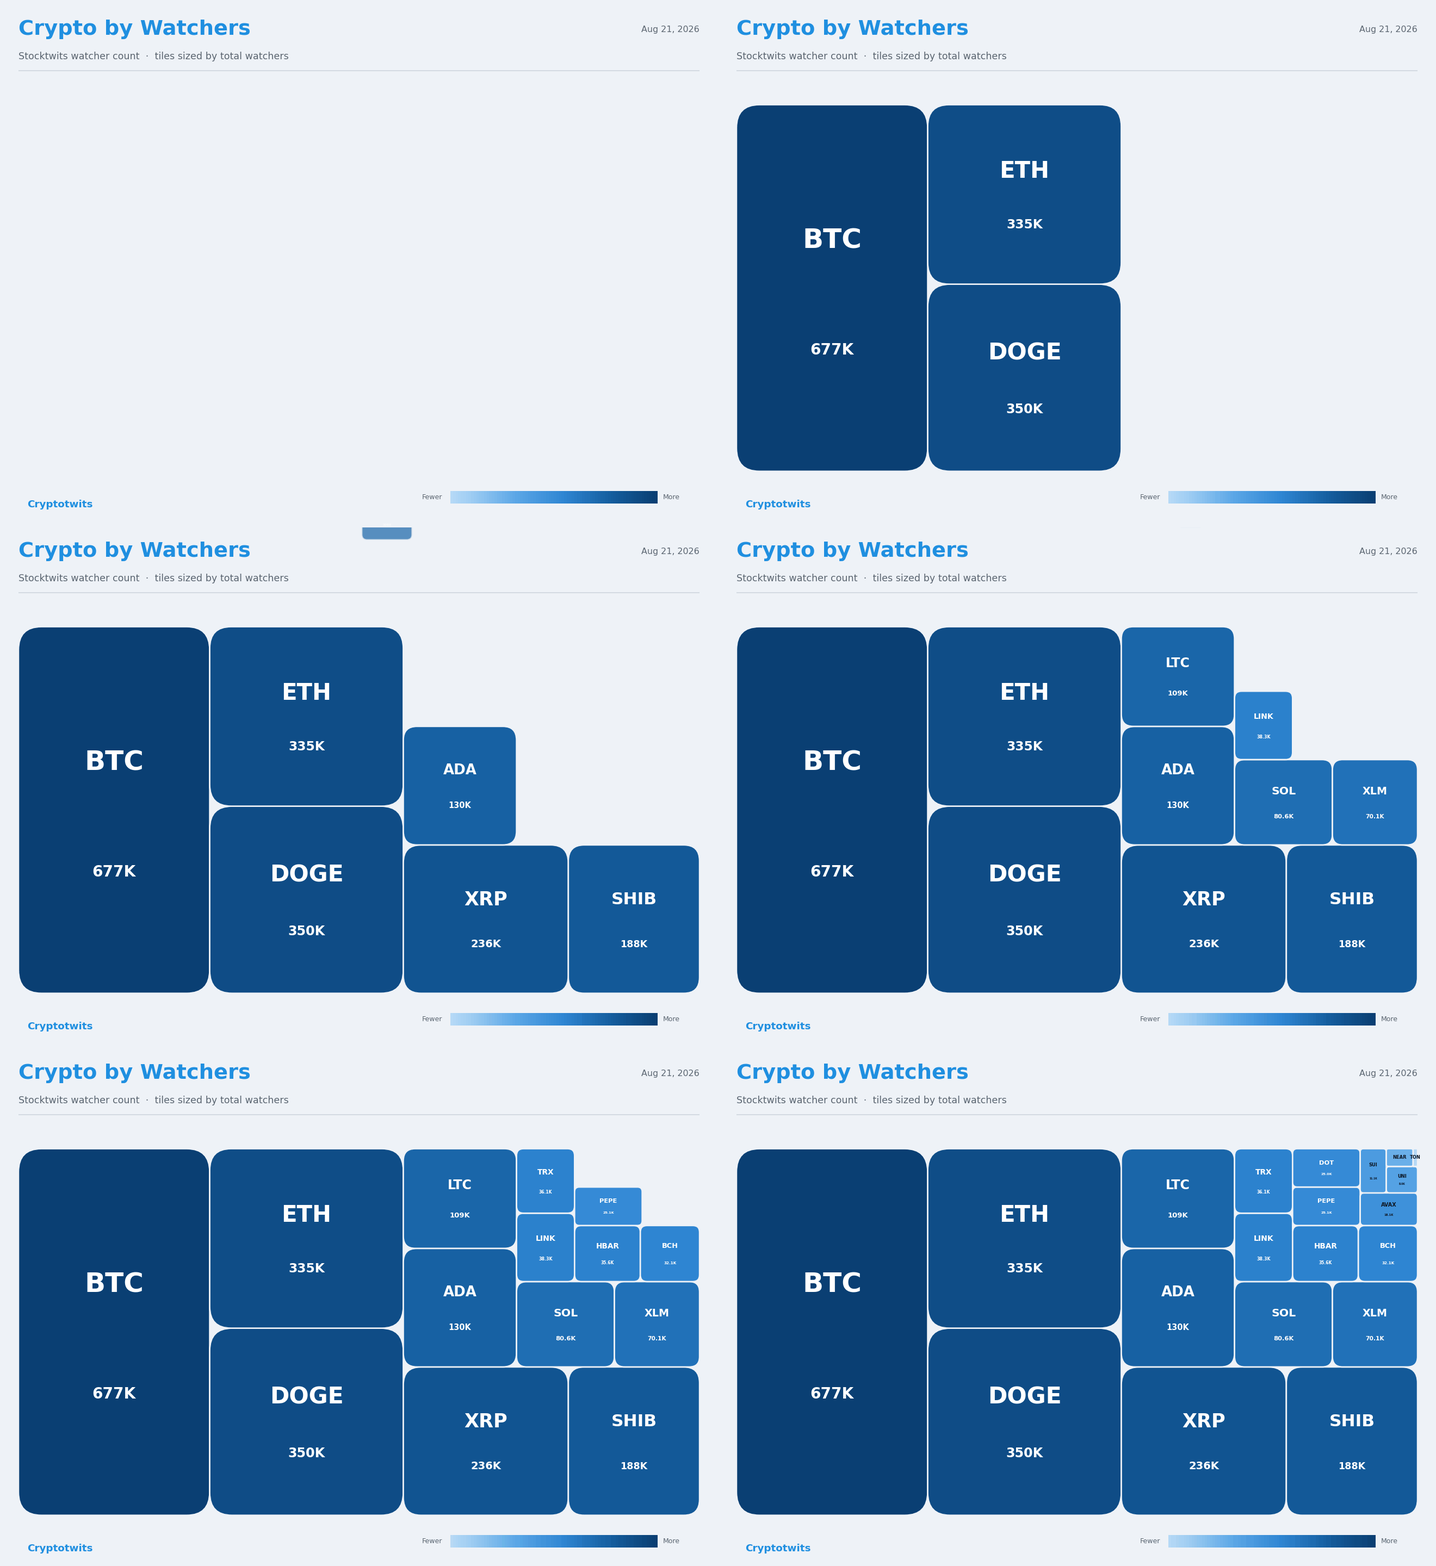
TECHNICAL ANALYSIS
This Is All Anyone Cares About: What Levels To Watch Out For 👀
I’m just gonna go out on a limb (you know, as I type that out, that sounds like such a stupid phrase) and assume no one right now really cares about ‘news’ today. I might even go so far to say on-chain activity isn’t much of a thing you want to read/see either. 📰
If you’re anything like me, and I know I am, I start to feel what a Minnesota Vikings fan feels when the Vikes have had a few strong wins. And some questions come up:
Is this real?
Can I psychologically and spiritually afford another disappointment after already experiencing, well, years of disappointment?
Just tell me where and/or when I can start to feel normal again.
Ya, I have no idea if this is real or when you can feel normal again, but if you’re looking for price levels that should be on your radar, well, today's newsletter might help. 👇
SPONSORED
Stop googling AI tools at midnight.

There are over 3,000 of them in The Shift’s vault, already vetted, ready to explore.
Subscribe and get instant access to the tool vault, a 1000+ prompt library, and free AI courses built for people with actual work to do.
Plus, the daily newsletter that keeps you sharp on everything moving in AI in under 5 minutes a day.
They’re also giving away a free 1-year Claude Pro subscription to 3 subscribers.
Subscribe for free to enter. All free. All in one place.
TECHNICAL ANALYSIS
Levels To Watch - Part One 🔢
Listen, when crypto starts to make crazy moves, they can be absolutely nuts and a lot of the near-term and immediate support/resistance levels can have the strength of single ply motel toiler paper. 🚽
But it’s good to at least know ‘where’ price action might need to recharge/fill up before continuing the Griswold family adventure its currently on.
Avalanche

AVAXUSD Daily Chart - Click to enlarge.
The last time $AVAX ( ▼ 0.22% ) close above the daily Cloud was May 15, 2026. It finally snapped that losers streak yesterday. Let’s not even talk about the last time the weekly chart closed above the weekly Cloud (the last week of December 2024). 😶
Oh, one random fun Ichimoku point: Avalanche’s price action is a good example how Kumo Twists can signal the beginning of a new move.
Despite AVAX triggering an Ideal Bullish Ichimoku Breakout, there is one thing holding it back from having a very strong sustained drive: the Chikou Span stuck inside the Cloud. Until AVAX, and, by default, the Chikou Span close above $7.925, this could be where AVAX finds some near-term resistance into the weekend. Throw in the the natural $8 level and the weekly Kijun-Sen, and it’s not hard to imagine a pause coming up.
But above $8? It’s wide open until the monthly Tenkan-Sen at $10.38. 🪂
Near-term Resistance: $8 value area.
Near-Term Support: $6.80 value area.
Bitcoin

BTCUSD Daily Chart - Click to enlarge.
No need to get long winded on this guy. $BTC ( ▼ 0.75% )’s near-term resistance is right where its currently having trouble: the monthly Tenkan-Sen at $78,378. And above that, there’s a cluster of resistance with the bottom of the weekly Cloud (Senkou Span A) and the monthly Kijun-Sen.
There’s a metric crap ton of support at the $68k to $70k value area because both the daily and weekly have their respective Tenkan-Sen and Kijun-Sen in that range. 🚂
Near-term Resistance: $78,400 value area.
Near-Term Support: $70,000 value area.
EDITORS PICK
Where retail traders find their next setup, delivered right to your inbox.

Where retail traders find their next setup.
Clean setups, key levels, and charts actually worth your screen time, curated from millions of Stocktwits traders. No noise, no guru upsell. In your inbox daily by 8PM ET.
TECHNICAL ANALYSIS
Levels To Watch - Part Two 🔢 👀
XRP

XRPUSD Daily Chart - Click to enlarge.
Wow. +41% so far for the week. That’s the best week since the week of November 25, 2024. 🥳
Since the week hasn’t close yet, I’m going to call near-term resistance for $XRP ( ▼ 0.77% ) at the weekly Kijun-Sen even though it’s currently trading above it. And there’s a good support zone on the daily chart with the top of the Cloud (Senkou Span B) at $1.16 and the daily Kijun-Sen and Tenkan-Sen at $1.20.
Also, I just have to throw the monthly chart in here as another example of how useful the Ichimoku Kinko Hyo system is. XRP’s monthly chart is a great example of how well price action respects the Cloud as a major support/resistance area. ☁

XRPUSD Monthly Chart - Click to enlarge.
Near-term Resistance: $1.295 value area.
Near-term Support: $1.20 value area.
Ethereum
We looked at Etheruem a little yesterday, but I wanted to touch on it again (and there’s another one of those ‘when you type it out and read it in your head it seems ewww’). 🤔
Much like Bitcoin, $ETH ( ▼ 0.52% ) is trading right up against it’s near-term major resistance today. And out of all the tickers we’re looking at today, ETH’s resistance is likely the strongest and most important to watch. Why? Because it’s based on the monthly Ichimoku chart.

ETHUSD Monthly Chart - Click to enlarge.
ETH is trading up against the strongest level of support/resistance (in this case, resistance) of the Ichimoku system: Senkou Span B. And it’s got the Tenkan-Sen parked right right on top of it, creating one hell of a place you’d expect some pause from any higher moves. Oh, and the monthly Chikou Span is up against the Cloud as well. Kind of a very rude double whammy.
But here’s the thing.
The Cloud is thin. Thin Clouds represent weakness. So, as strong as Senkou Span B and the Cloud is, the closer Senkou Span A gets to Senkou Span B, the weaker Span B gets. In a nutshell, what I’m saying is it’s easier, just look how easily it dropped below the Cloud between January and February of this year. 📉
Near-Term Resistance: $2,500 value area.
Near-Term Support: $2,100 value area.

TECHNICAL ANALYSIS
Levels To Watch - Part Three 🔢 👀
Solana
Solana is officially old enough of an asset that it has a complete monthly Ichimoku chart. What do I mean by that? Well, just look at the monthly chart:

SOLUSD Monthly Chart - Click to enlarge.
See how wonky and incomplete it was? The last Ichimoku indicator to print in this situation is Senkou Span B, which is simply the mid point between the Tenkan-Sen and Kijun-Sen. BUT, because the Ichimoku system project the Cloud forward 26 periods, what we’re really looking at for Senkou Span B is the mid point of the Kijun-Sen and Tenkan-Sen from 26 months ago. Wrap your head around that.
Anyway, similar to Bitcoin, not much to go over here with $SOL ( ▼ 0.64% ). Why? Because there’s just a massive hole of nothing between where it is and it’s next resistance level. It’s bottom of the monthly Cloud (Senkou Span B) and the monthly Tenkan-Sen as the next major resistance level.
Near-Term Resistance: $122 value area.
Near-Term Support: $81 value area.
Sui
Haven’t looked at this turd in a while. It’s up +20% so far on the week, and +11 today. And unless something really really bad happens, $SUI ( ▼ 0.11% ) will have a confirmed Ideal Bullish Ichimoku Breakout on its daily chart.

SUIUSD Daily Chart - Click to enlarge.
Similar thing to what we saw with Avalanche: the Chikou Span really needs to close above the Cloud. If it doesn’t, then there’s some near-term chop in the $0.88 to $0.91 range.
Near-term Resistance: $1.024 value area.
Near-term Support: $0.74
Get In Touch 📬
Email me, Jonathan Morgan, feedback; I’d love to hear from you. 📧
Follow me on Stocktwits 🫂 And Sponsor this newsletter 😎
|
Get the app Real-time alerts, live earnings calls, your personalised feed - the best experience is on mobile.
|


Terms & Conditions 📝
Securities Disclaimer: STOCKTWITS IS NOT A TAX ADVISOR, BROKER, FINANCIAL ADVISOR OR INVESTMENT ADVISOR. THE SERVICE IS NOT INTENDED TO PROVIDE TAX, LEGAL, FINANCIAL OR INVESTMENT ADVICE, AND NOTHING ON THE SERVICE SHOULD BE CONSTRUED AS AN OFFER TO SELL, A SOLICITATION OF AN OFFER TO BUY, OR A RECOMMENDATION FOR ANY SECURITY. Trading in such securities can result in immediate and substantial losses of the capital invested. You should only invest risk capital, and not capital required for other purposes. You alone are solely responsible for determining whether any investment, security or strategy, or any other product or service, is appropriate or suitable for you based on your investment objectives and personal and financial situation. You should also consult an attorney or tax professional regarding your specific legal or tax situation. The Content is to be used for informational and entertainment purposes only and the Service does not provide investment advice for any individual. Stocktwits, its affiliates and partners specifically disclaim any and all liability or loss arising out of any action taken in reliance on Content, including but not limited to market value or other loss on the sale or purchase of any company, property, product, service, security, instrument, or any other matter. You understand that an investment in any security is subject to a number of risks, and that discussions of any security published on the Service will not contain a list or description of relevant risk factors. In addition, please note that some of the stocks about which Content is published on the Service have a low market capitalization and/or insufficient public float. Such stocks are subject to more risk than stocks of larger companies, including greater volatility, lower liquidity and less publicly available information. Read the full terms & conditions here. 🔍
Author Disclosure: The author of this newsletter holds positions in AVAX, ADA, PUDGY, WLD, NEAR, INJ, LTC, LINK, ZEC, XLM, and FET. 📋