- Cryptotwits
- Posts
- Profit From Panic 😨
ON-CHAIN ANALYSIS
Profit From Panic 😨

"Buy when there is blood in the streets" is one of the oldest pieces advice in finance, but it’s useless without a map to tell you when the bleeding has stopped. 🤔
In today's newsletter, we're going to look at two on-chain analysis metrics that can help filter out the emotional FUD and panic and give a more objective view of where some tickers are sitting.
To do that, we're going to look at the SOPR and MVRV Z-Score for Bitcoin, Ethereum, Solana, Aave, and XRP.
The Spent Out Profit Ratio (SOPR) tells us whether the investors moving money right now are taking profits or panic-selling at a loss, acting as a real-time "fear gauge" for the market.
The MVRV Z-Score tells us if the asset is mathematically overvalued or undervalued relative to its "fair" realized price, helping us distinguish between a true bargain and a falling knife.
Together, they provide a complete navigation system: MVRV tells you if the house is cheap, and SOPR tells you if the seller is desperate enough to close the deal.
CRYPTOTWITS
Crypto Projects: Claim Your Token on Stocktwits! 🤯
Your crypto project now has an official home on Stocktwits.Founders, team members, and community managers can now claim your token, get verified, and manage how your project appears to hundreds of thousands of traders.Claiming your page unlocks features that establish trust, amplify your voice, and keep your followers informed. This is everything you get:
Pin Important Messages: Keep your most important news at the top of your page for maximum visibility.
Get Verified Badge Credibility: Show your community you're the real deal with a badge that signals authenticity.
Direct Line to Stocktwits: The Stocktwits community team can help you customize your project page and maximize your reach to the community.
Engage Directly With Followers: Reply, share updates, and connect with followers from your official project account.
ON-CHAIN ANALYSIS
Bitcoin - Controlled Bleed 🩸
BTC SOPR - from victory laps to grinding discomfort
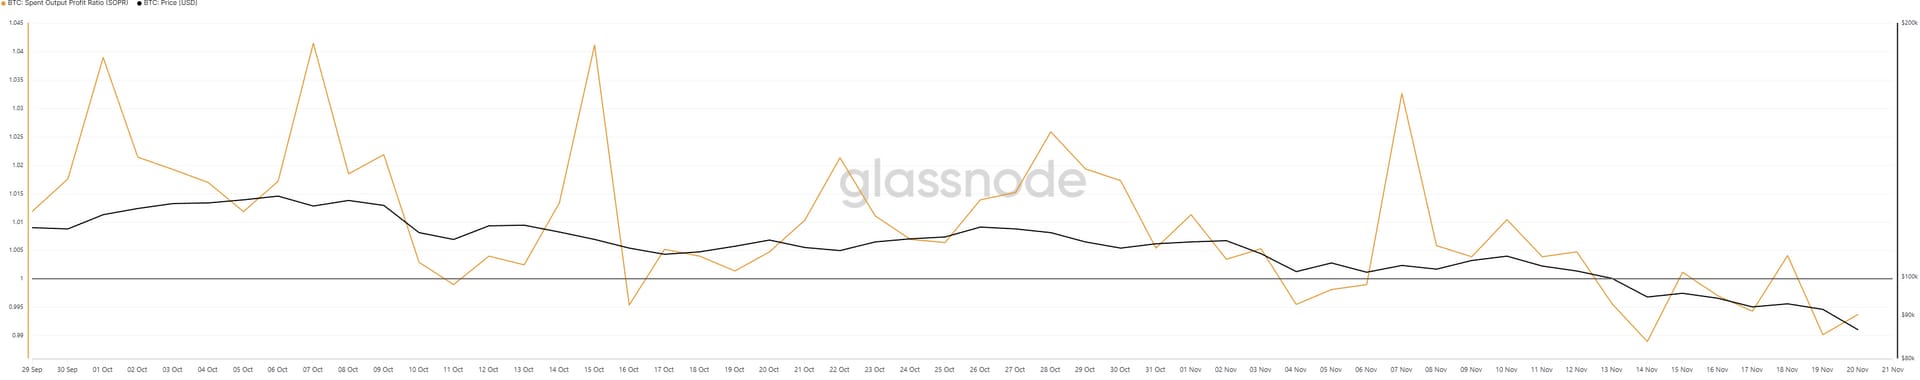
Click to enlarge.
Early in the quarter), $BTC.X ( ▲ 0.4% ) ’s SOPR sits comfortably above 1. Then the tone shifts.
At first, strong hands harvest gains.
Later, as the trend softens, you see more coins spent at or near a loss, especially during bounces.
When SOPR can’t stay above 1 on rallies, it signals weak trend and distribution on every pop.
So BTC holders went from “I sell when I feel rich” to “I sell because this thing keeps slipping and I’m tired.”
BTC MVRV Z‑Score - froth drained, not fully reset
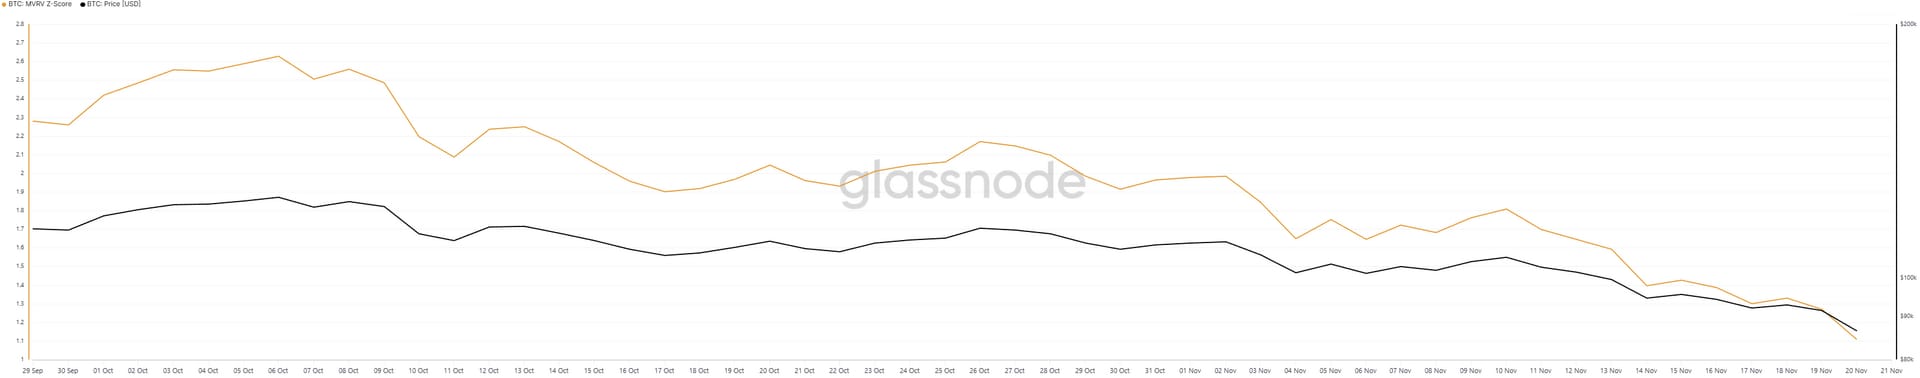
Click to enlarge.
Early October, the MVRV lives up in roughly the 2.0-2.6 zone. Not blow‑off‑top insanity, but clearly elevated.
Over the period, MVRV grinds lower along with price, sliding toward the low 1s by the end of the chart.
The earlier BTC rally did carry some excess unrealized profit.
This pullback has been actively bleeding that premium out.
The MVRV doesn’t collapse toward 0. It doesn’t go negative. It never hit true bargain territory.
TL;DR
SOPR says short‑term trend is weak and sellers are increasingly forced to realize smaller losses.
MVRV Z says the market has moved from “a bit hot” to “fair-ish,” not “dirt cheap.”
Lean: short‑term bearish, structurally fine.
Net: BTC sits in a mid‑cycle corrective phase, with a bearish short‑term lean but no evidence of a terminal top. 🧠
ON-CHAIN ANALYSIS
Ethereum - Pain Phase, But Actually Interesting 😯
ETH SOPR - sliding into a loss zone
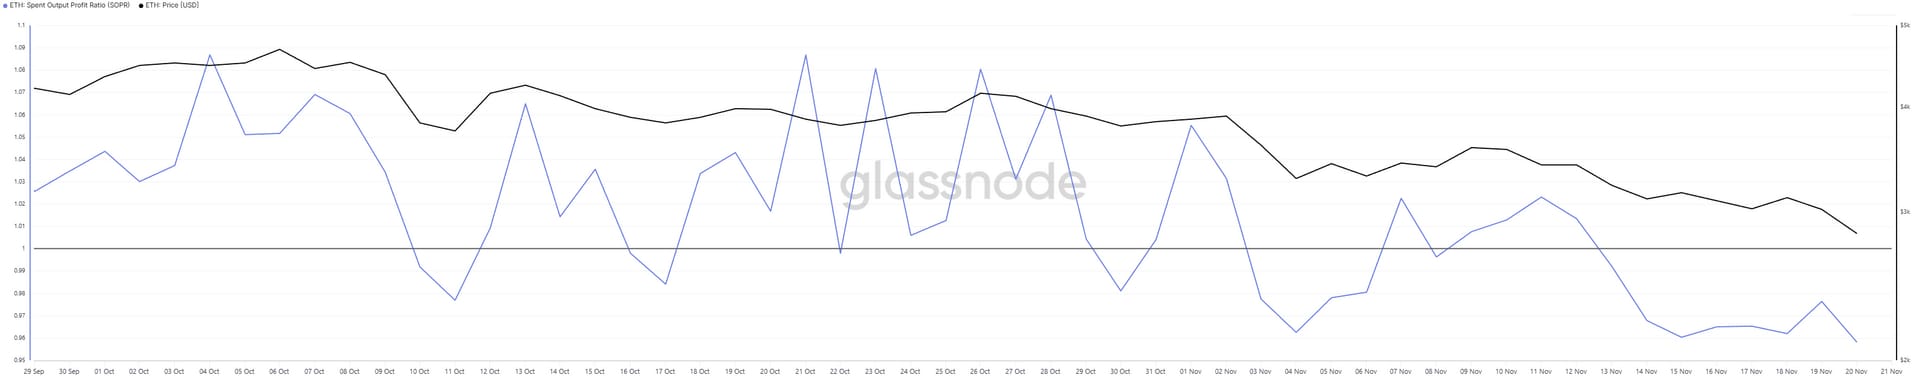
Click to enlarge.
Early in October, ETH’s SOPR stays above 1 with modest spikes. Then life gets annoying. Through the middle and into November:
SOPR turns messy, whipping above and below 1 for a bit, then starts spending more time below 1.
In the back half of the chart, the story is consistent sub‑1 prints as price trends down.
Late buyers are cutting size.
Coins are regularly being spent at a loss.
Weak hands are actively getting rinsed, not flexing gains.
ETH MVRV Z‑Score - valuation properly reset
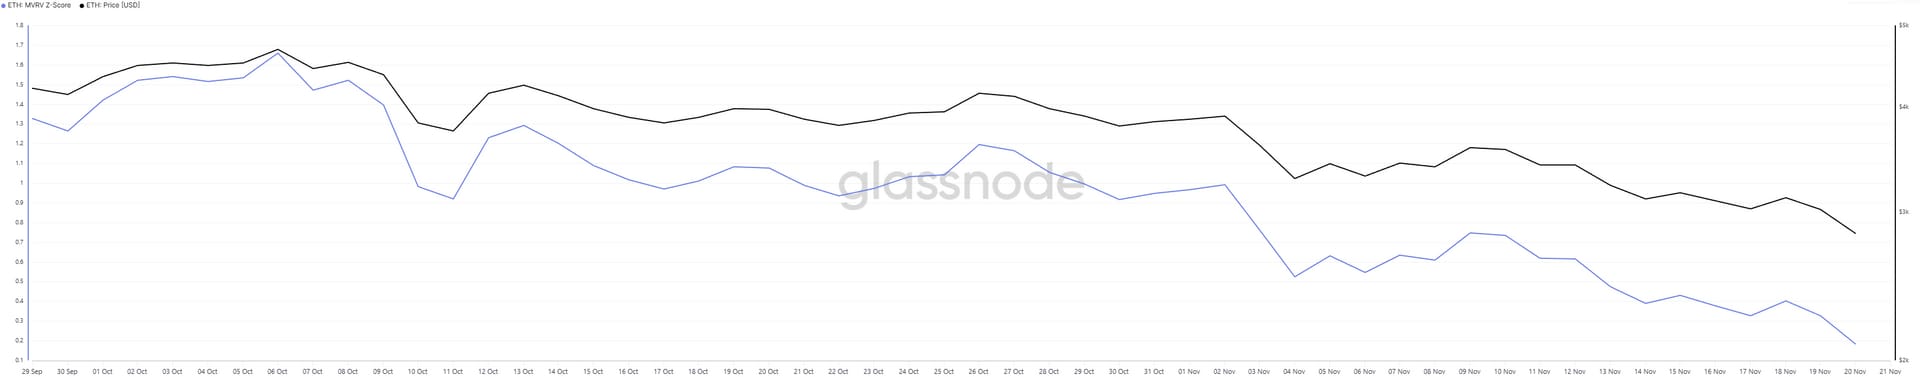
Click to enlarge.
Early on, $ETH.X ( ▲ 1.05% ) ’s MVRV sits around 1.5-1.7. Mildly hot, not insane.
Over time, it slides steadily lower alongside price.
By the end of the chart, the MVRV has dropped into the 0.x area, hovering not far above 0.
High MVRV = lots of unrealized profit, vulnerable to violent mean reversion.
Low MVRV near 0 = market value is sitting roughly on top of realized value, meaning a huge chunk of prior excess has been unwound.
TL;DR
SOPR shows ongoing loss realization and cleanup of late buyers.
MVRV Z shows valuation compressed toward fair value.
Lean: bullish from a risk/reward standpoint.
Net: bullish lean, with the caveat that timing it perfectly still belongs to masochists.
So yes, trend still looks bad on the surface, but structurally this is closer to an accumulation region than a top. 😐️
ON-CHAIN ANALYSIS
Solana - Ugly Chart But Attractive Wreckage 🤕
SOL SOPR - capitulation vibes
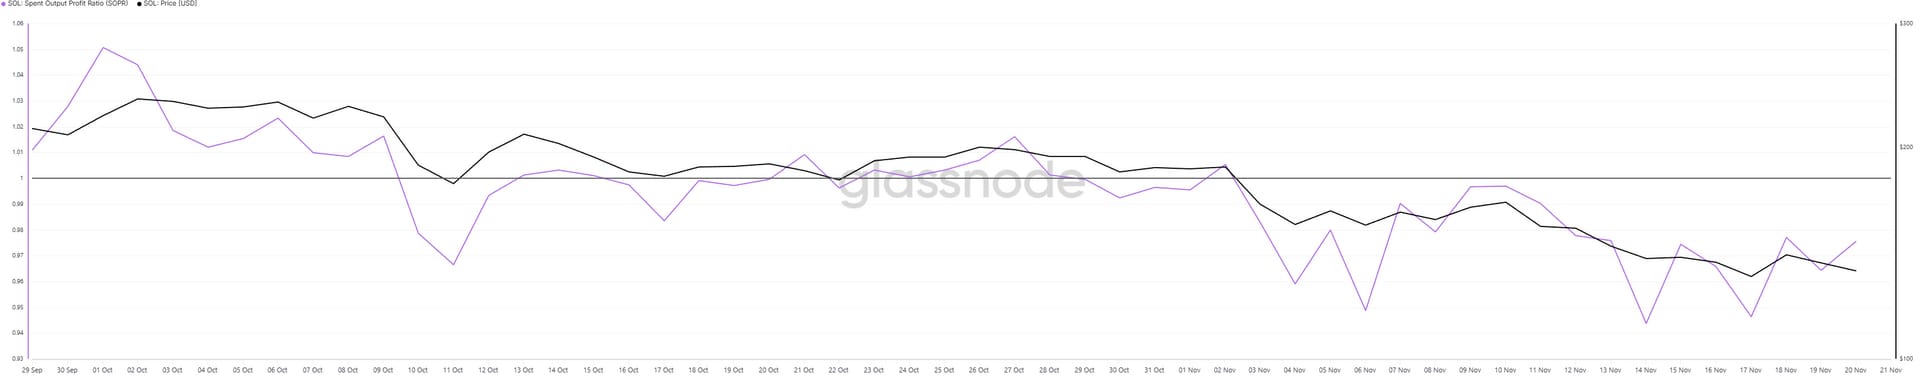
Click to enlarge.
In early October, $SOL.X ( ▼ 1.68% ) ’s SOPR floats comfortably above 1, profit taking as SOL holds higher levels.
Then comes October 9-11; SOPR falls well below 1, into the 0.96-0.97 area as price rolls over.
That’s the first convincing loss‑selling event.
From there into November, the SOPR repeatedly dips below 1, with multiple spikes toward the low 0.9s.
Even the bounces struggle to reclaim and hold >1.
It looks like:
A sustained phase where holders are selling into weakness, not into strength.
Late entries are getting flushed.
Market is burning off the impatient segment of the holder base.
SOPR is telling you we’re deep in the weak‑hand purge phase.
SOL MVRV Z‑Score - actual cheap, not pretend cheap
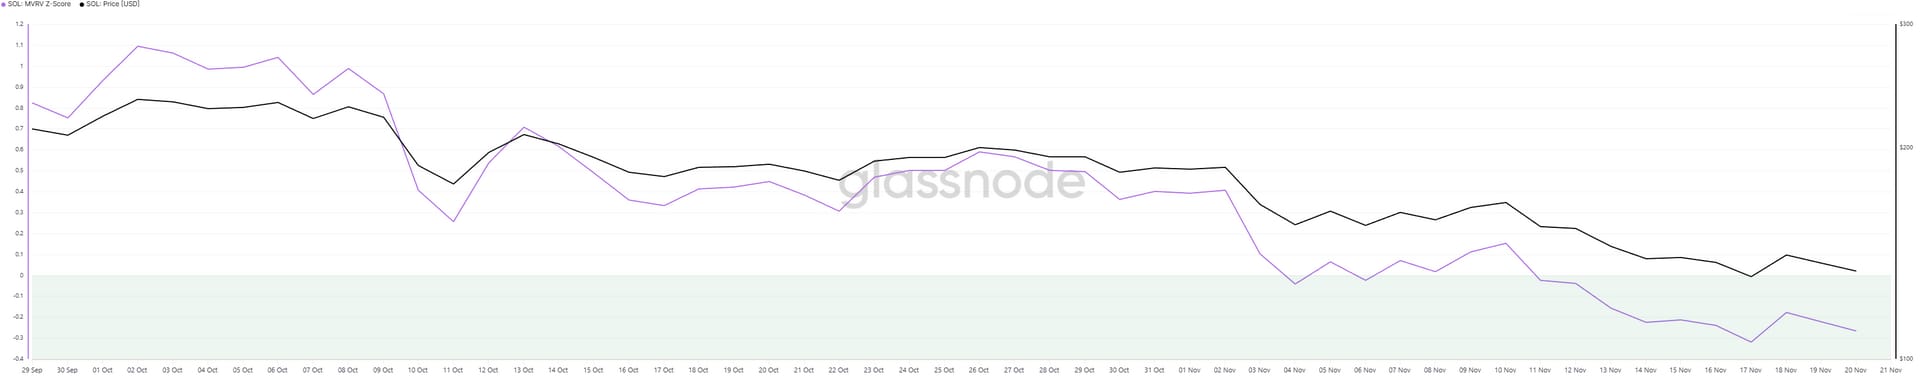
Click to enlarge.
Here’s where SOL separates itself from BTC and XRP (the last one we’ll look at today).
Early October, the MVRV sits around 0.7-1.1. So some premium, but nothing wild.
Mid October, as price gives back, the MVRV fades into the 0.4-0.7 region.
Then early November, the elevator breaks: MVRV slides through 0 and goes negative.
Historically, that’s where good forward returns tend to start brewing, because:
There’s not much structural profit left to dump.
Surviving holders either have conviction or no better options.
TL;DR
SOPR shows ongoing loss realization and capitulation.
MVRV Z shows SOL has been re‑priced into genuine value territory.
Lean: Bullish. Stronger than ETH, structurally.
Net: SOL looks fundamentally washed out, with on‑chain pointing to bullish asymmetry, even if price can always overshoot lower to terrorize everyone first.
So, not too bad overall? I mean besides the blood bath it’s in already. 🏥
ON-CHAIN ANALYSIS
Aave - DeFi’s Overachiever In Suffering 🤮
AAVE SOPR - from profits to an actual puke
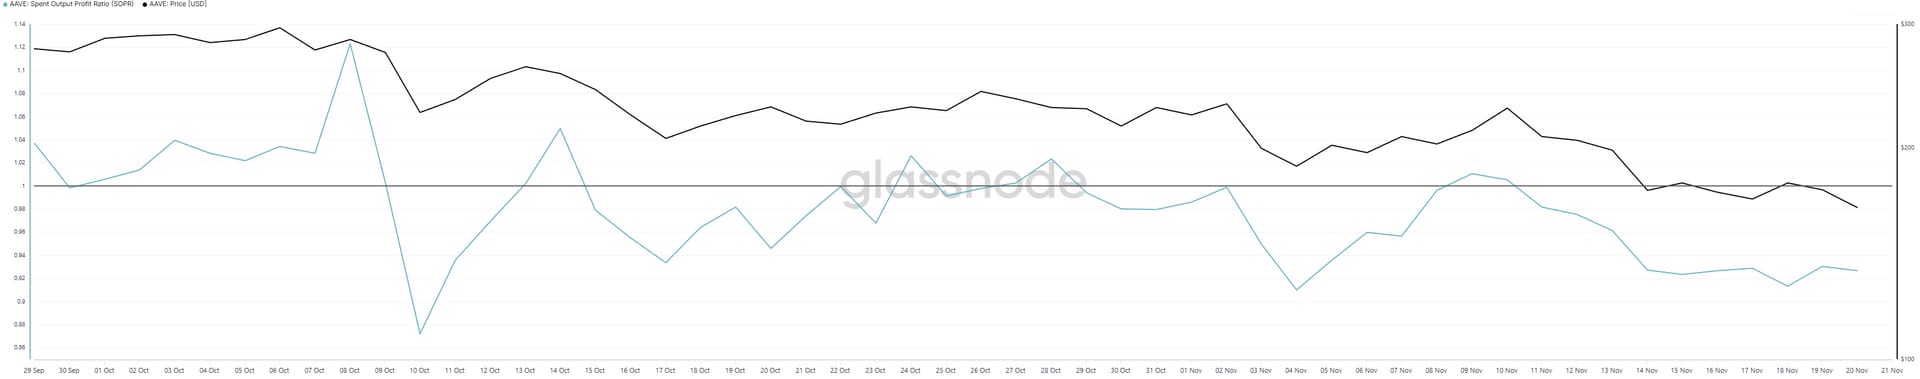
Click to enlarge.
At the start of Rektober, SOPR holds above 1, hovering around 1.02-1.05.
Then spikes even higher to ~1.13 while price tops locally.
Then things gets violent around October 9-10: SOPR collapses from comfortably above 1 to roughly 0.86.
That’s a proper flush, heavy loss realization in a short window.
After that, the SOPR spends time oscillating around 1, then gradually drifts below 1 as price trends down into November.
So, structurally:
Early profit harvesting.
Violent de‑risking.
Ongoing loss spending as the market grinds lower.
AAVE MVRV Z‑Score - living in the negative zone
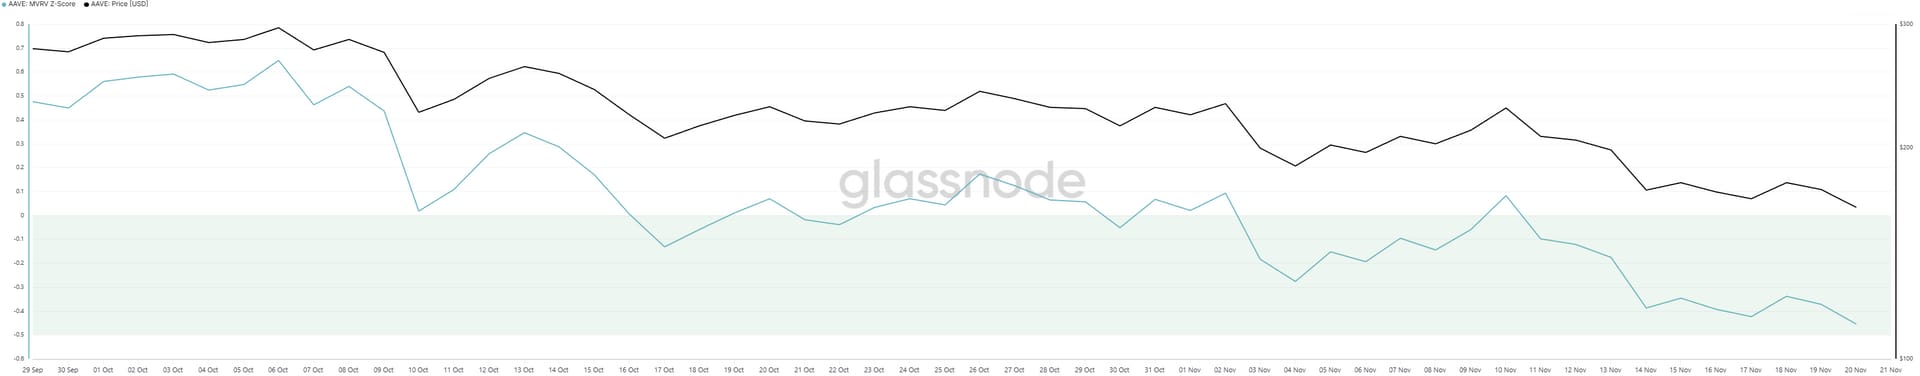
Click to enlarge.
Late September to early October, the MVRV hangs out around 0.5-0.75. Mild premium, nothing crazy.
Same Oct 9-10 window that wrecked SOPR sends the MVRV down toward 0 and then below it.
After a small bounce, the MVRV spends most of the rest of the chart firmly negative, drifting toward roughly ‑0.35 to ‑0.45 by late November.
So AAVE is sitting in a group where:
Market cap is below realized cap.
A lot of holders are underwater.
Any remaining sellers are either forced or numb.
TL;DR
SOPR: huge puke plus continued loss realization.
MVRV Z: persistent negative readings, deep in the “everyone sad” band.
Lean: bullish. One of the cleaner on‑chain “depressed” setups.
Net: AAVE looks like depressed DeFi, not distribution. On‑chain leans bullish for medium‑term positioning, even if price is still sulking.
And the crazy part? Lending in DeFi is still stupidly high and rising, the total opposite of $AAVE.X ( ▲ 2.2% ) ’s price action. 📉
ON-CHAIN ANALYSIS
XRP - Still Handing Out Exit Liquidity 😠
XRP SOPR - distribution with occasional drama
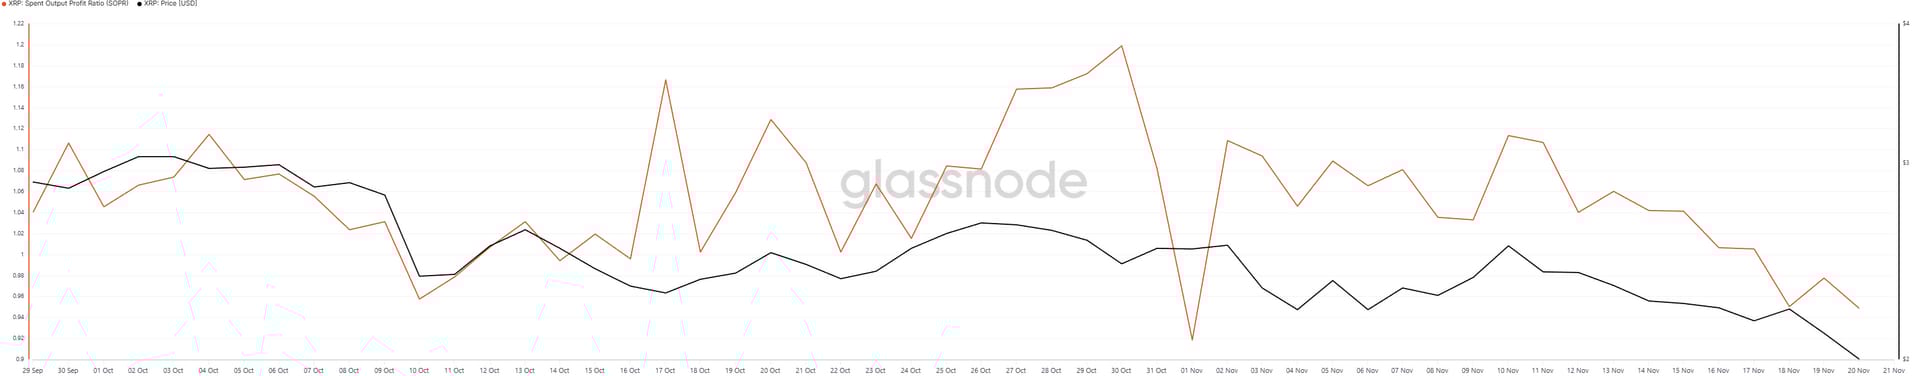
Click to enlarge.
The SOPR for $XRP.X ( ▲ 0.0% ) is basically one long “I’ll just sell into every bounce, thanks.”
For most of the quarter so far, the SOPR stays above 1, often firmly above, with spikes north of 1.1.
Early October, while price holds up, spent coins are clearly in profit. Holders are trimming into strength.
Around Oct 10-11, SOPR dips below 1 briefly as price wobbles.
End of October / early November shows a sharp vertical stab lower near 0.92, a quick flash of capitulation.
SOPR snaps right back above 1 and keeps hovering there into November.
Even as price fades, realized spends are still generally profit‑positive.
XRP MVRV Z‑Score - from rich to just “fine”
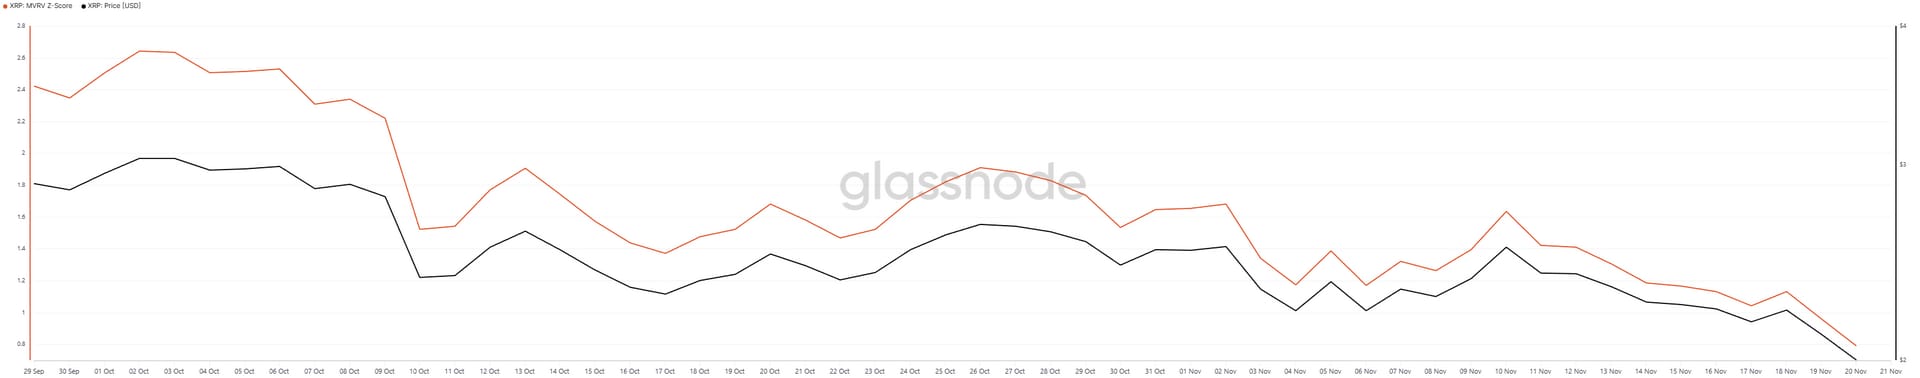
Click to enlarge.
Late September and early October, the MVRV sits around 2.3-2.6. That’s elevated. Holders nicely in the green.
Through October and into November, it slides, but mostly into the 1.3-1.8 range.
XRP went from clearly expensive to moderately above fair value.
A lot of unrealized profit has been trimmed.
There is still plenty of holder profit left in the system.
TL;DR
SOPR mostly above 1 = rallies still used as exit liquidity by winners.
MVRV Z positive throughout = holder base still carries decent profit, so structural sell pressure on bounces is very real.
Lean: bearish.
Net: XRP gets a bearish lean here. It’s not unsalvageable, but on‑chain doesn’t show the same washed‑out opportunity you see in SOL or AAVE.
Drifting down under that backdrop = looks more like a distribution unwind than a cleared-out bottom. 🤷
ON-CHAIN ANALYSIS
Big Picture Scoreboard 🔢
If we line them up purely off these SOPR + MVRV Z reads:
Most washed‑out / attractive:
AAVE - negative MVRV, post‑puke SOPR, DeFi pain special.
SOL - negative M, repeated loss spending, classic capitulation setup.
Constructively reset but not wrecked:
ETH - MVRV near 0, SOPR in loss regime. Good risk/reward if you like staring at red for a bit.
Mid‑cycle correction, still not “cheap”:
BTC - MVRV down from 2s to low 1s, SOPR slipping under 1. Short‑term bearish, cycle still alive.
Still distributing:
XRP - SOPR mostly above 1, MVRV always positive. Holders remain in profit and happy to sell. Bearish lean.
And there it is. 🤘
Terms & Conditions 📝
Securities Disclaimer: STOCKTWITS IS NOT A TAX ADVISOR, BROKER, FINANCIAL ADVISOR OR INVESTMENT ADVISOR. THE SERVICE IS NOT INTENDED TO PROVIDE TAX, LEGAL, FINANCIAL OR INVESTMENT ADVICE, AND NOTHING ON THE SERVICE SHOULD BE CONSTRUED AS AN OFFER TO SELL, A SOLICITATION OF AN OFFER TO BUY, OR A RECOMMENDATION FOR ANY SECURITY. Trading in such securities can result in immediate and substantial losses of the capital invested. You should only invest risk capital, and not capital required for other purposes. You alone are solely responsible for determining whether any investment, security or strategy, or any other product or service, is appropriate or suitable for you based on your investment objectives and personal and financial situation. You should also consult an attorney or tax professional regarding your specific legal or tax situation. The Content is to be used for informational and entertainment purposes only and the Service does not provide investment advice for any individual. Stocktwits, its affiliates and partners specifically disclaim any and all liability or loss arising out of any action taken in reliance on Content, including but not limited to market value or other loss on the sale or purchase of any company, property, product, service, security, instrument, or any other matter. You understand that an investment in any security is subject to a number of risks, and that discussions of any security published on the Service will not contain a list or description of relevant risk factors. In addition, please note that some of the stocks about which Content is published on the Service have a low market capitalization and/or insufficient public float. Such stocks are subject to more risk than stocks of larger companies, including greater volatility, lower liquidity and less publicly available information. Read the full terms & conditions here. 🔍
Author Disclosure: The author of this newsletter holds positions in AVAX, ADA, PUDGY, WLC, IMX, XTZ, NEAR, HBAR, ALGO, INJ, LTC, LINK, ZEC, XLM, and FET. 📋
