
OVERVIEW
Zillow For Crypto: What The House Down The Street Went For 🏚
Here’s What’s Happening 👇
Quick note on language before we start. When I say "record," "all-time," "deepest ever," or "in history" in here, I'm not talking about every price these coins have ever printed. I mean the history of the data I'm using, which starts in January 2021. Nearly six years is a long time in crypto. It is not forever. 📏
ON-CHAIN ANALYTICS
The Structural Conviction Index: This Week Vs. Its Own History 🔬
Every asset in here gets measured against itself and nobody else. The question for each one is the same: where does this week's reading sit against that asset's own highs, lows, and ranges going back nearly six years, and what happened the last several times it was standing in this exact spot? 🪞
That last part is the new piece. For each asset I pulled every past week where the index sat within a few points of today's level and was moving the same direction, then checked where it was eight weeks later. Call it the comparables. It's the on-chain version of asking the realtor what the house down the street went for. 🧹
PROMOTION
BitcoinIRA Has More Than Bitcoin. A Lot More.
BitcoinIRA gives you access to 100+ cryptocurrencies, one-click crypto bundles, and staking rewards on select assets - all inside a self-directed crypto IRA.

Buy, sell, and swap 100+ cryptocurrencies
Build diversified crypto bundles with automated rebalancing
Earn staking rewards on select assets inside your IRA*
Choose Traditional or Roth IRA options, with tax treatment depending on the account type*
*3rd Party Ad. Not an offer or recommendation by Stocktwits. See disclosure here.
ON-CHAIN ANALYTICS
Bitcoin: The Decline Quit Early And The Whales Just Showed Up 🐳
Click to enlarge.
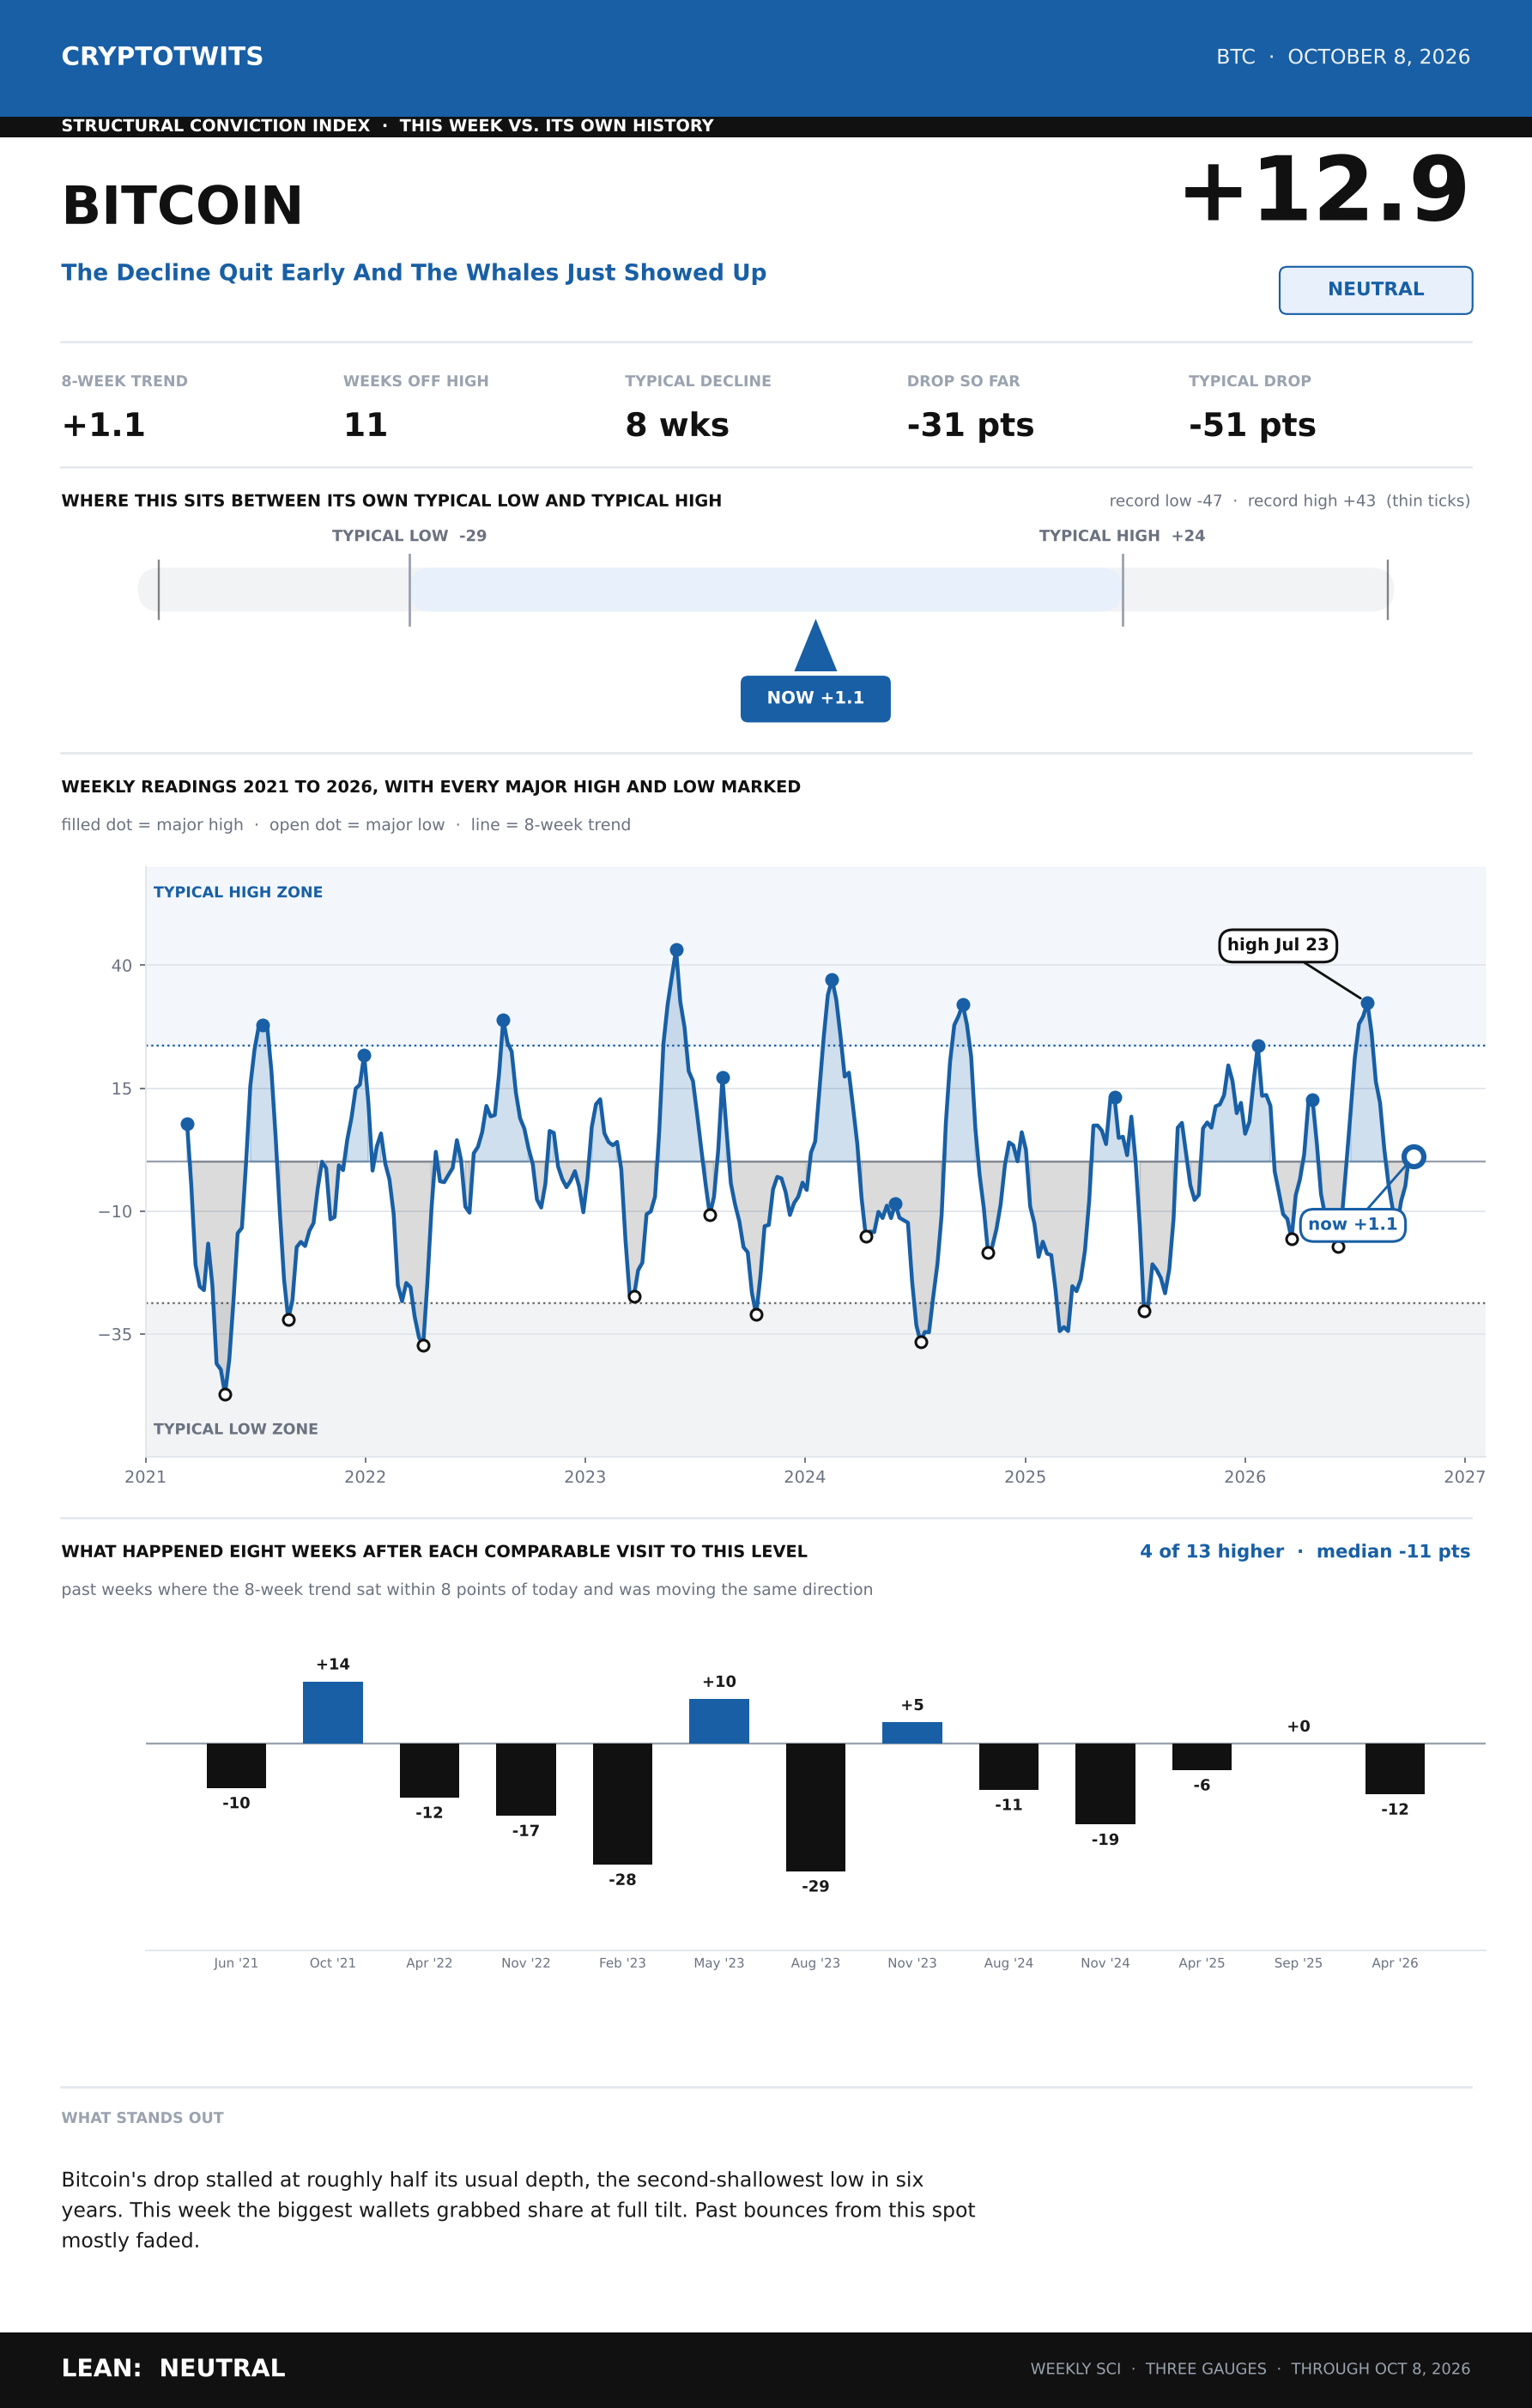
Bitcoin's index topped in late July, fell for seven weeks, and then stopped. Not at the floor. About halfway down. 🛑
Where It Sits
Depth of the drop: thirty-one points. A normal one covers fifty-one.
The low it made: the second-shallowest in six years of readings.
Since then: four straight weeks higher, back to a hair above zero.
Ten of twelve past declines went deeper. This one had the decency to leave early, like a houseguest who reads the room.
What The Comparables Say
This week the biggest wallets grabbed share at the maximum reading, which is the signature every real $BTC ( ▲ 0.99% ) high has carried and the one that was missing all summer. Great news, in theory.
Then you check the neighbors. Thirteen past weeks had the index at this level and climbing. Eight weeks later, nine of them were lower. The typical outcome was a slide back into the teens below zero. The last time it looked like this was April, and April rolled over inside a month.
So which is it? A whale signature that usually marks a top, arriving four weeks into a bounce that usually fails. The coins themselves have gone slightly younger for the first time in months, and exchange flows flipped to net outflows over the past month after a summer of the opposite. Mixed room. Nobody's leaving, nobody's ordering another round. 🍻
Lean: Neutral
ON-CHAIN ANALYTICS
Ethereum: Deepest Drop In The Record, Now Below Where It Normally Bottoms 🕳️
Click to enlarge.
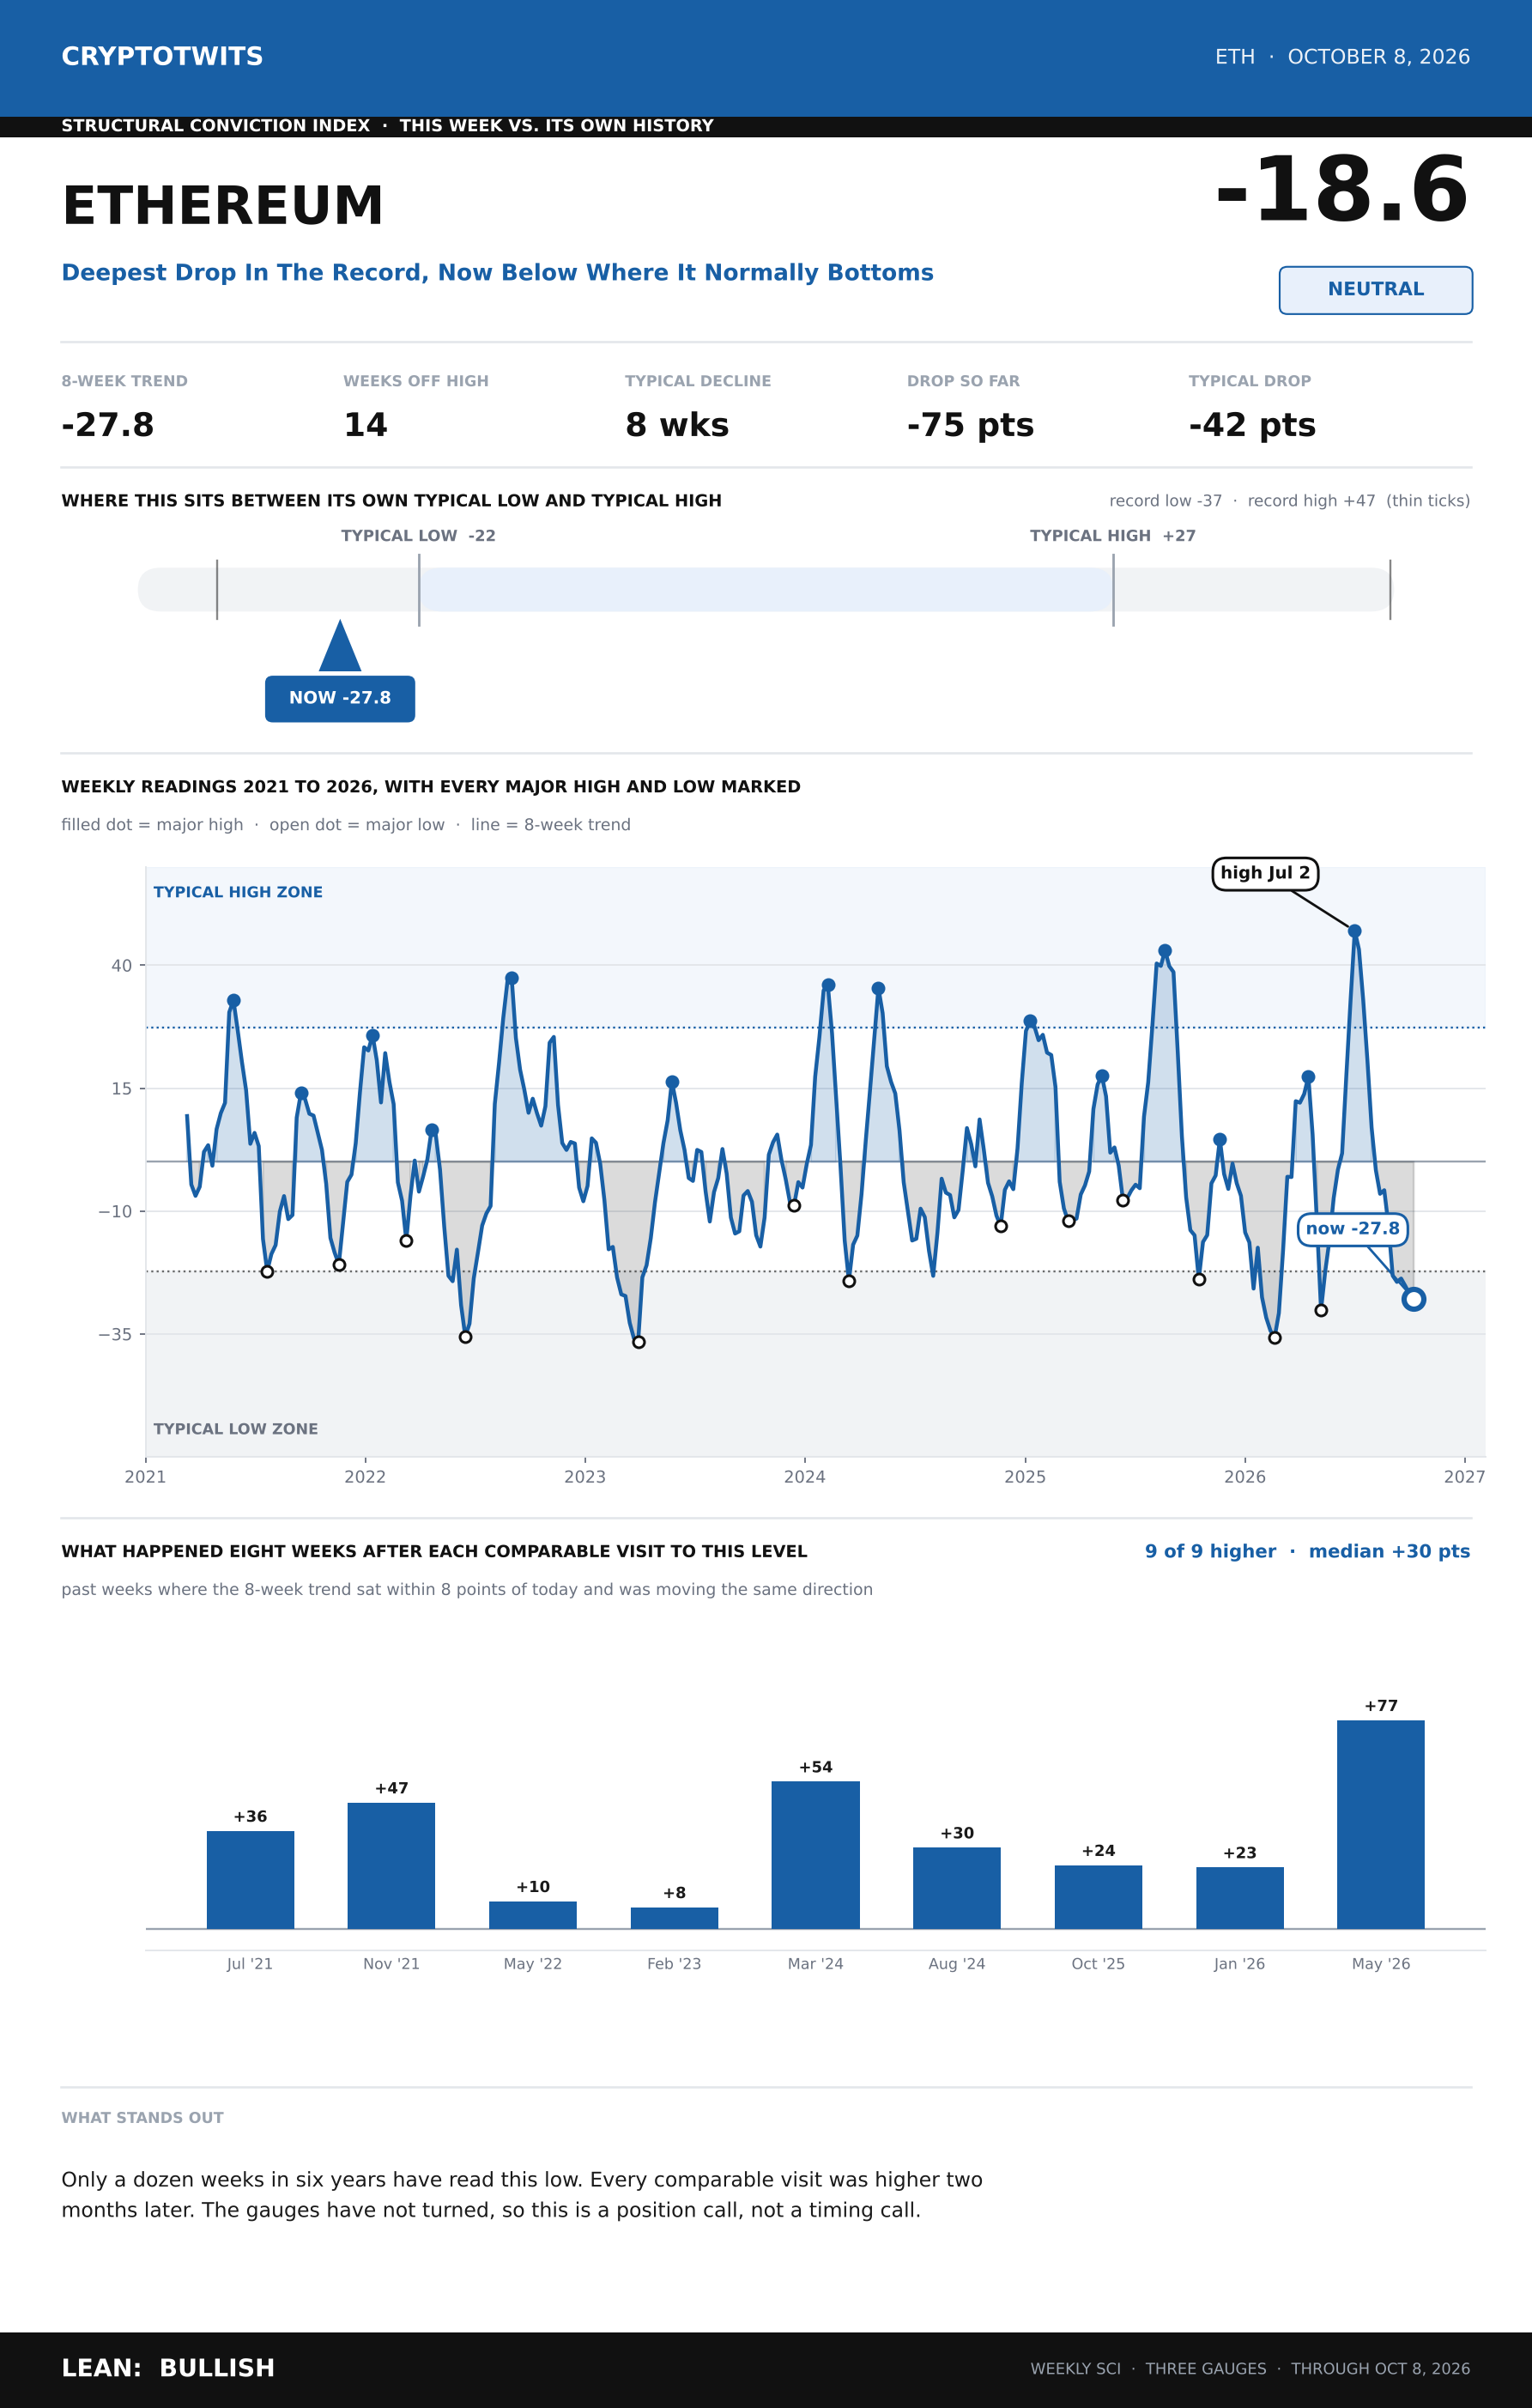
$ETH ( ▲ 0.02% ) set the highest reading in its record on July 2, and it has spent the fourteen weeks since finding out how far down the stairs go. The answer is: all of them, and then a few more. 🪜
Where It Sits
Depth of the drop: seventy-five points. A normal one covers forty-two.
Biggest decline in the record: by a wide margin. Nothing else is close.
Current level: below where Ethereum normally bottoms, and within shouting distance of the all-time low.
Only twelve weeks out of nearly three hundred have ever read this low. Three of them were June 2022. Three were March 2023. You remember how those months felt.
What The Comparables Say
Nine past weeks had the index down here and still falling. Eight weeks later, all nine were higher. Not most. All. The typical bounce was thirty points, and the weakest of the nine still managed eight.
The gauges have not turned yet, which is the honest caveat. Coins are aging hard, which is the good part. Exchange flows went to inflows over the past month after a year of steady outflows, which is not. And the largest wallets are shedding share about as fast as the gauge can measure, which is a thing they've been doing since 2022 and show no sign of stopping. That big tier has given up roughly four points of total supply in the past twelve months alone.
Average coin age sits a week off its all-time record. The holders who are left are not going anywhere. The question is whether anyone joins them.
This is a position call, not a timing call. Bulls are likely looking at this neighborhood with interest. Bears have had a very good quarter and know it. 🐻
Lean: Bullish
ON-CHAIN ANALYTICS
Chainlink: Seven Weeks Off The High, With The Floor Still A Long Way Down 🔗
Click to enlarge.
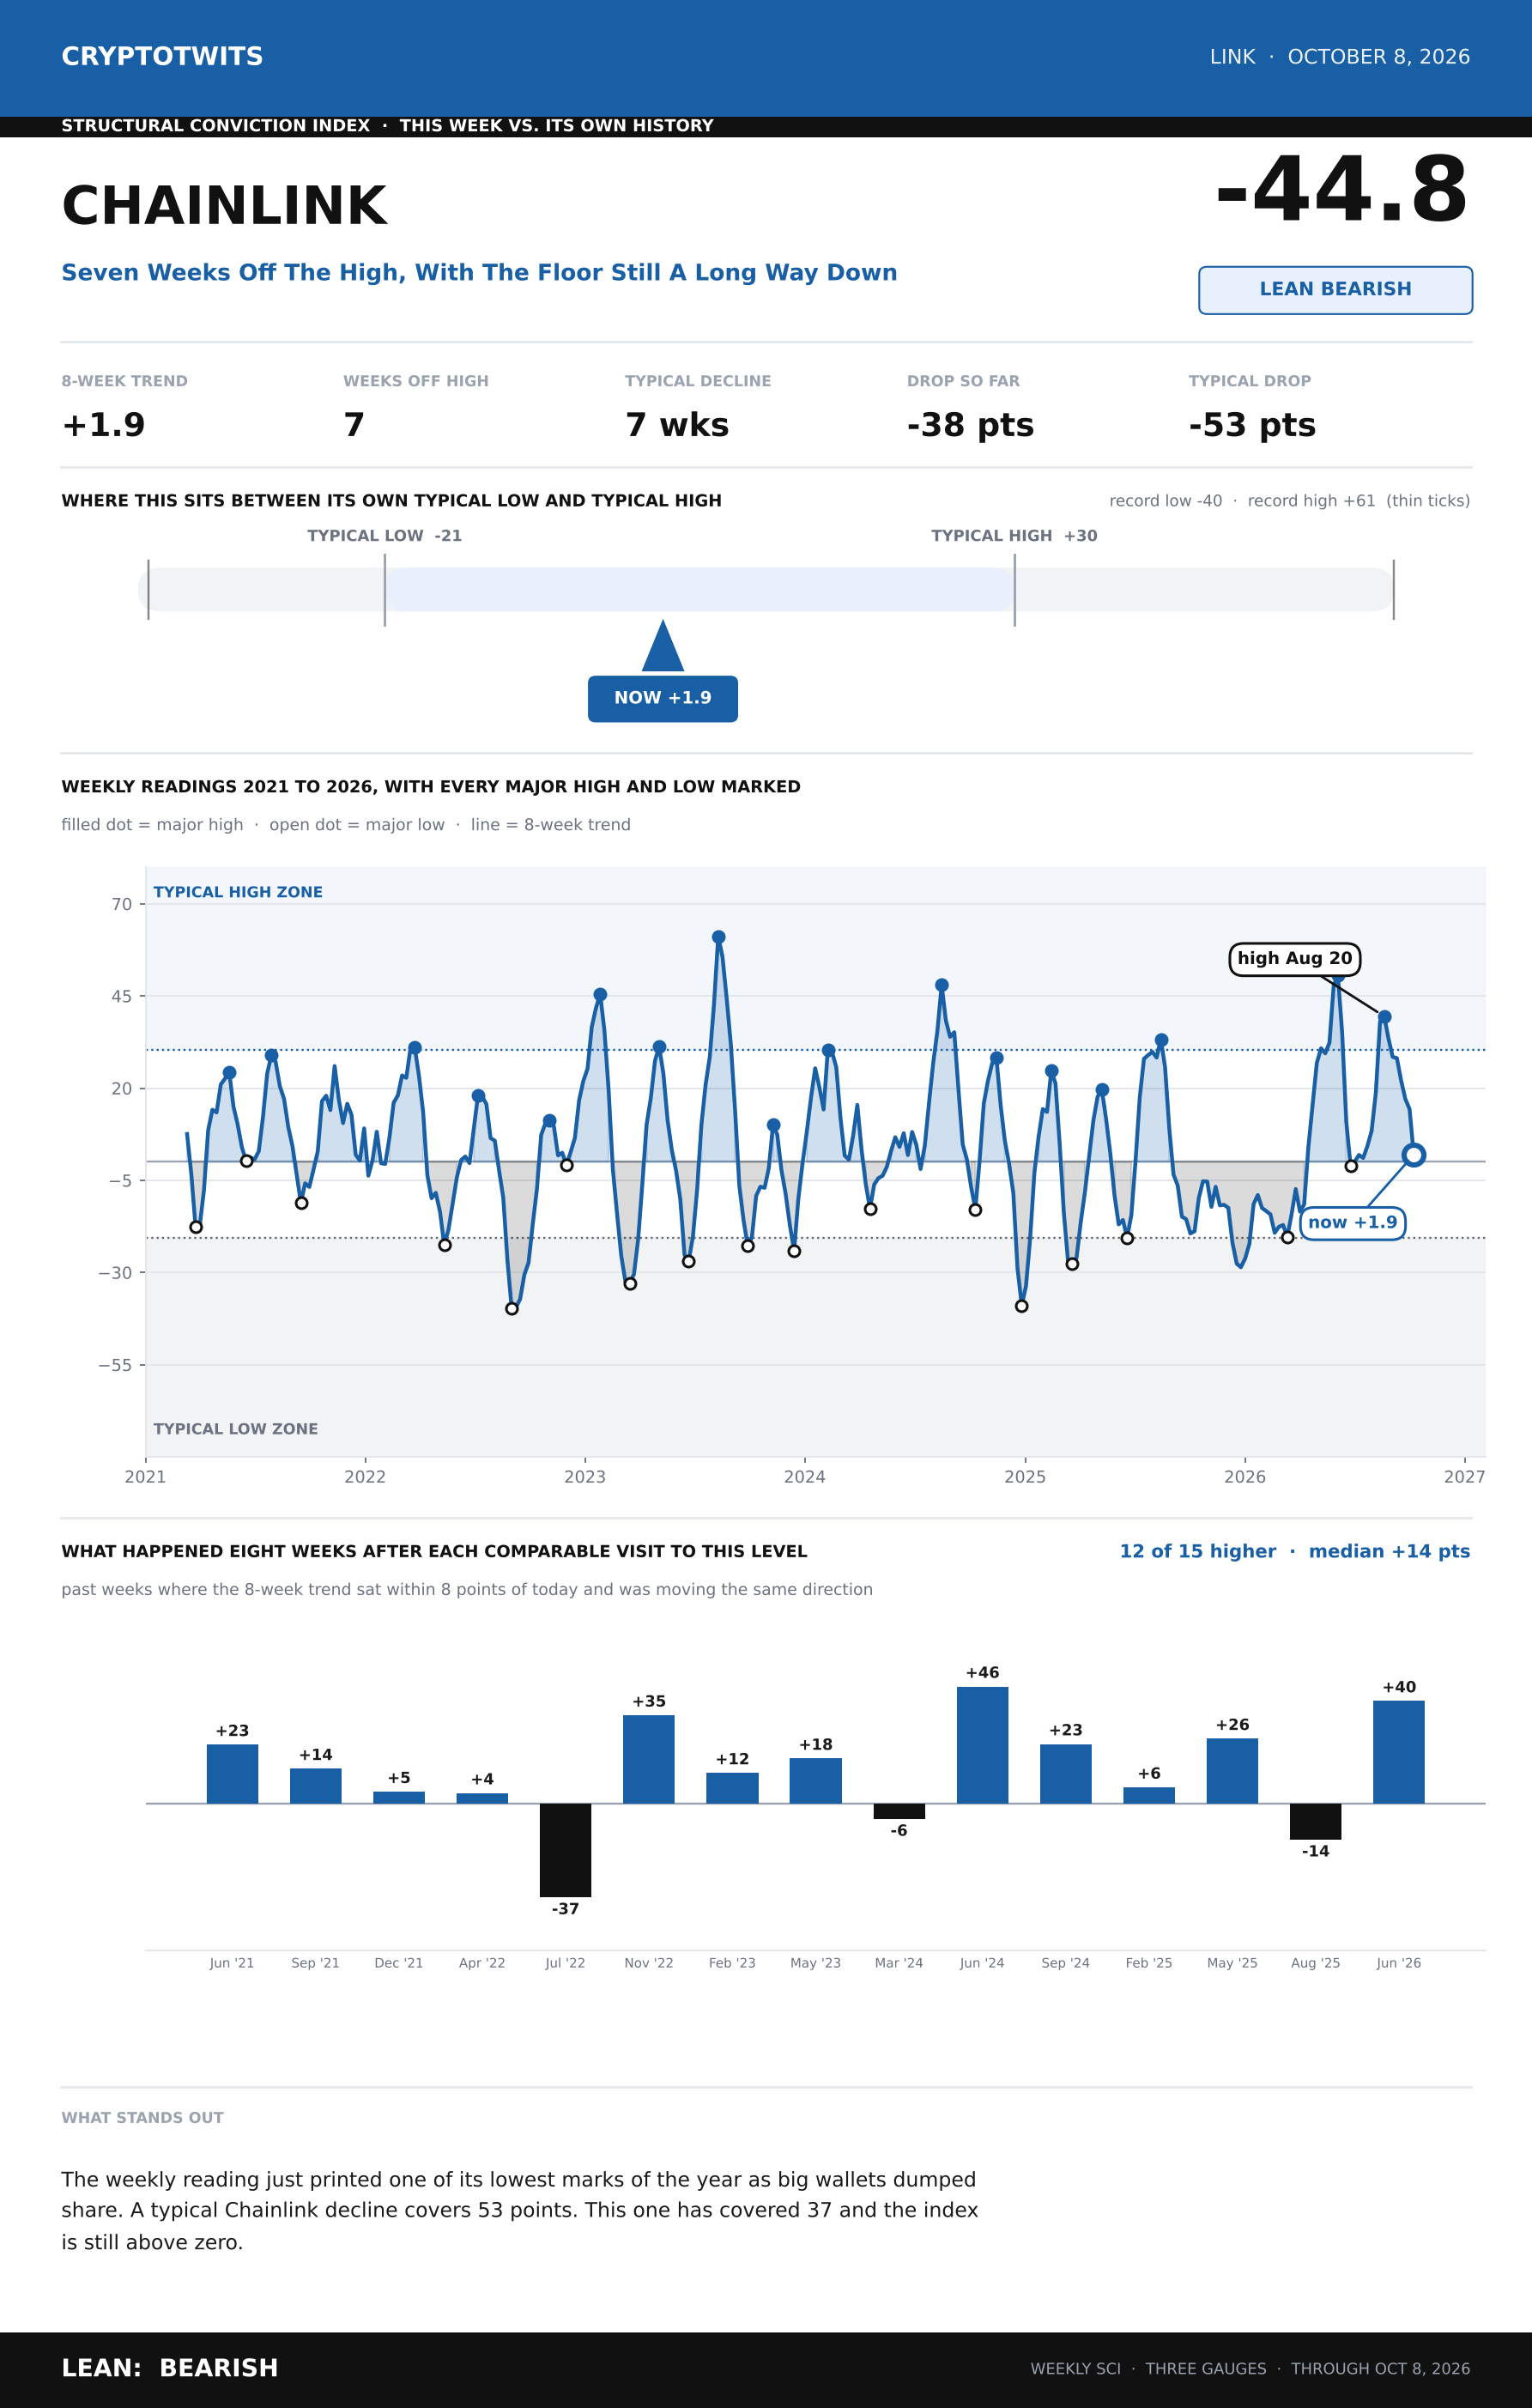
Chainlink's index made its high on August 20 and has been coming down for seven weeks. This week it fell through the floorboards. 🪵
Where It Sits
Depth of the drop: thirty-seven points, against a typical fifty-three.
This week's raw reading: one of the lowest of the year, as the biggest wallets dumped share at full speed.
The trend line: still a touch above zero, with the typical low twenty-odd points further down.
A normal $LINK ( ▲ 0.45% ) decline lasts seven weeks. This one is seven weeks old. But the normal decline also finishes well below zero, and this one is still standing on the line pretending it hasn't been hit.
What The Comparables Say
Fifteen past weeks had the trend near zero and falling. Twelve were higher eight weeks later. That's a decent record, and if this were any other asset I'd lean on it harder.
The problem is the scale of what just happened underneath. The two largest wallet bands I track for LINK now hold roughly forty-nine percent of supply, up from forty-one a year ago, and the concentration gauge still printed its worst possible score this week because the two-week rate of change swung hard against them. That's whales who spent a year hoarding deciding to let a little go all at once. Exchange flows turned to inflows over the past month after a year of leaving. Coin age is still rising, the one thing holding this up.
Mid-decline with the floor a long way off and the big money suddenly fidgety. Bears getting giddy. Bulls would feel better twenty points lower. 😬
Lean: Bearish
ON-CHAIN ANALYTICS
Cardano: Sitting On The Floor With A Near-Perfect Record Of Getting Up 🪑
Click to enlarge.
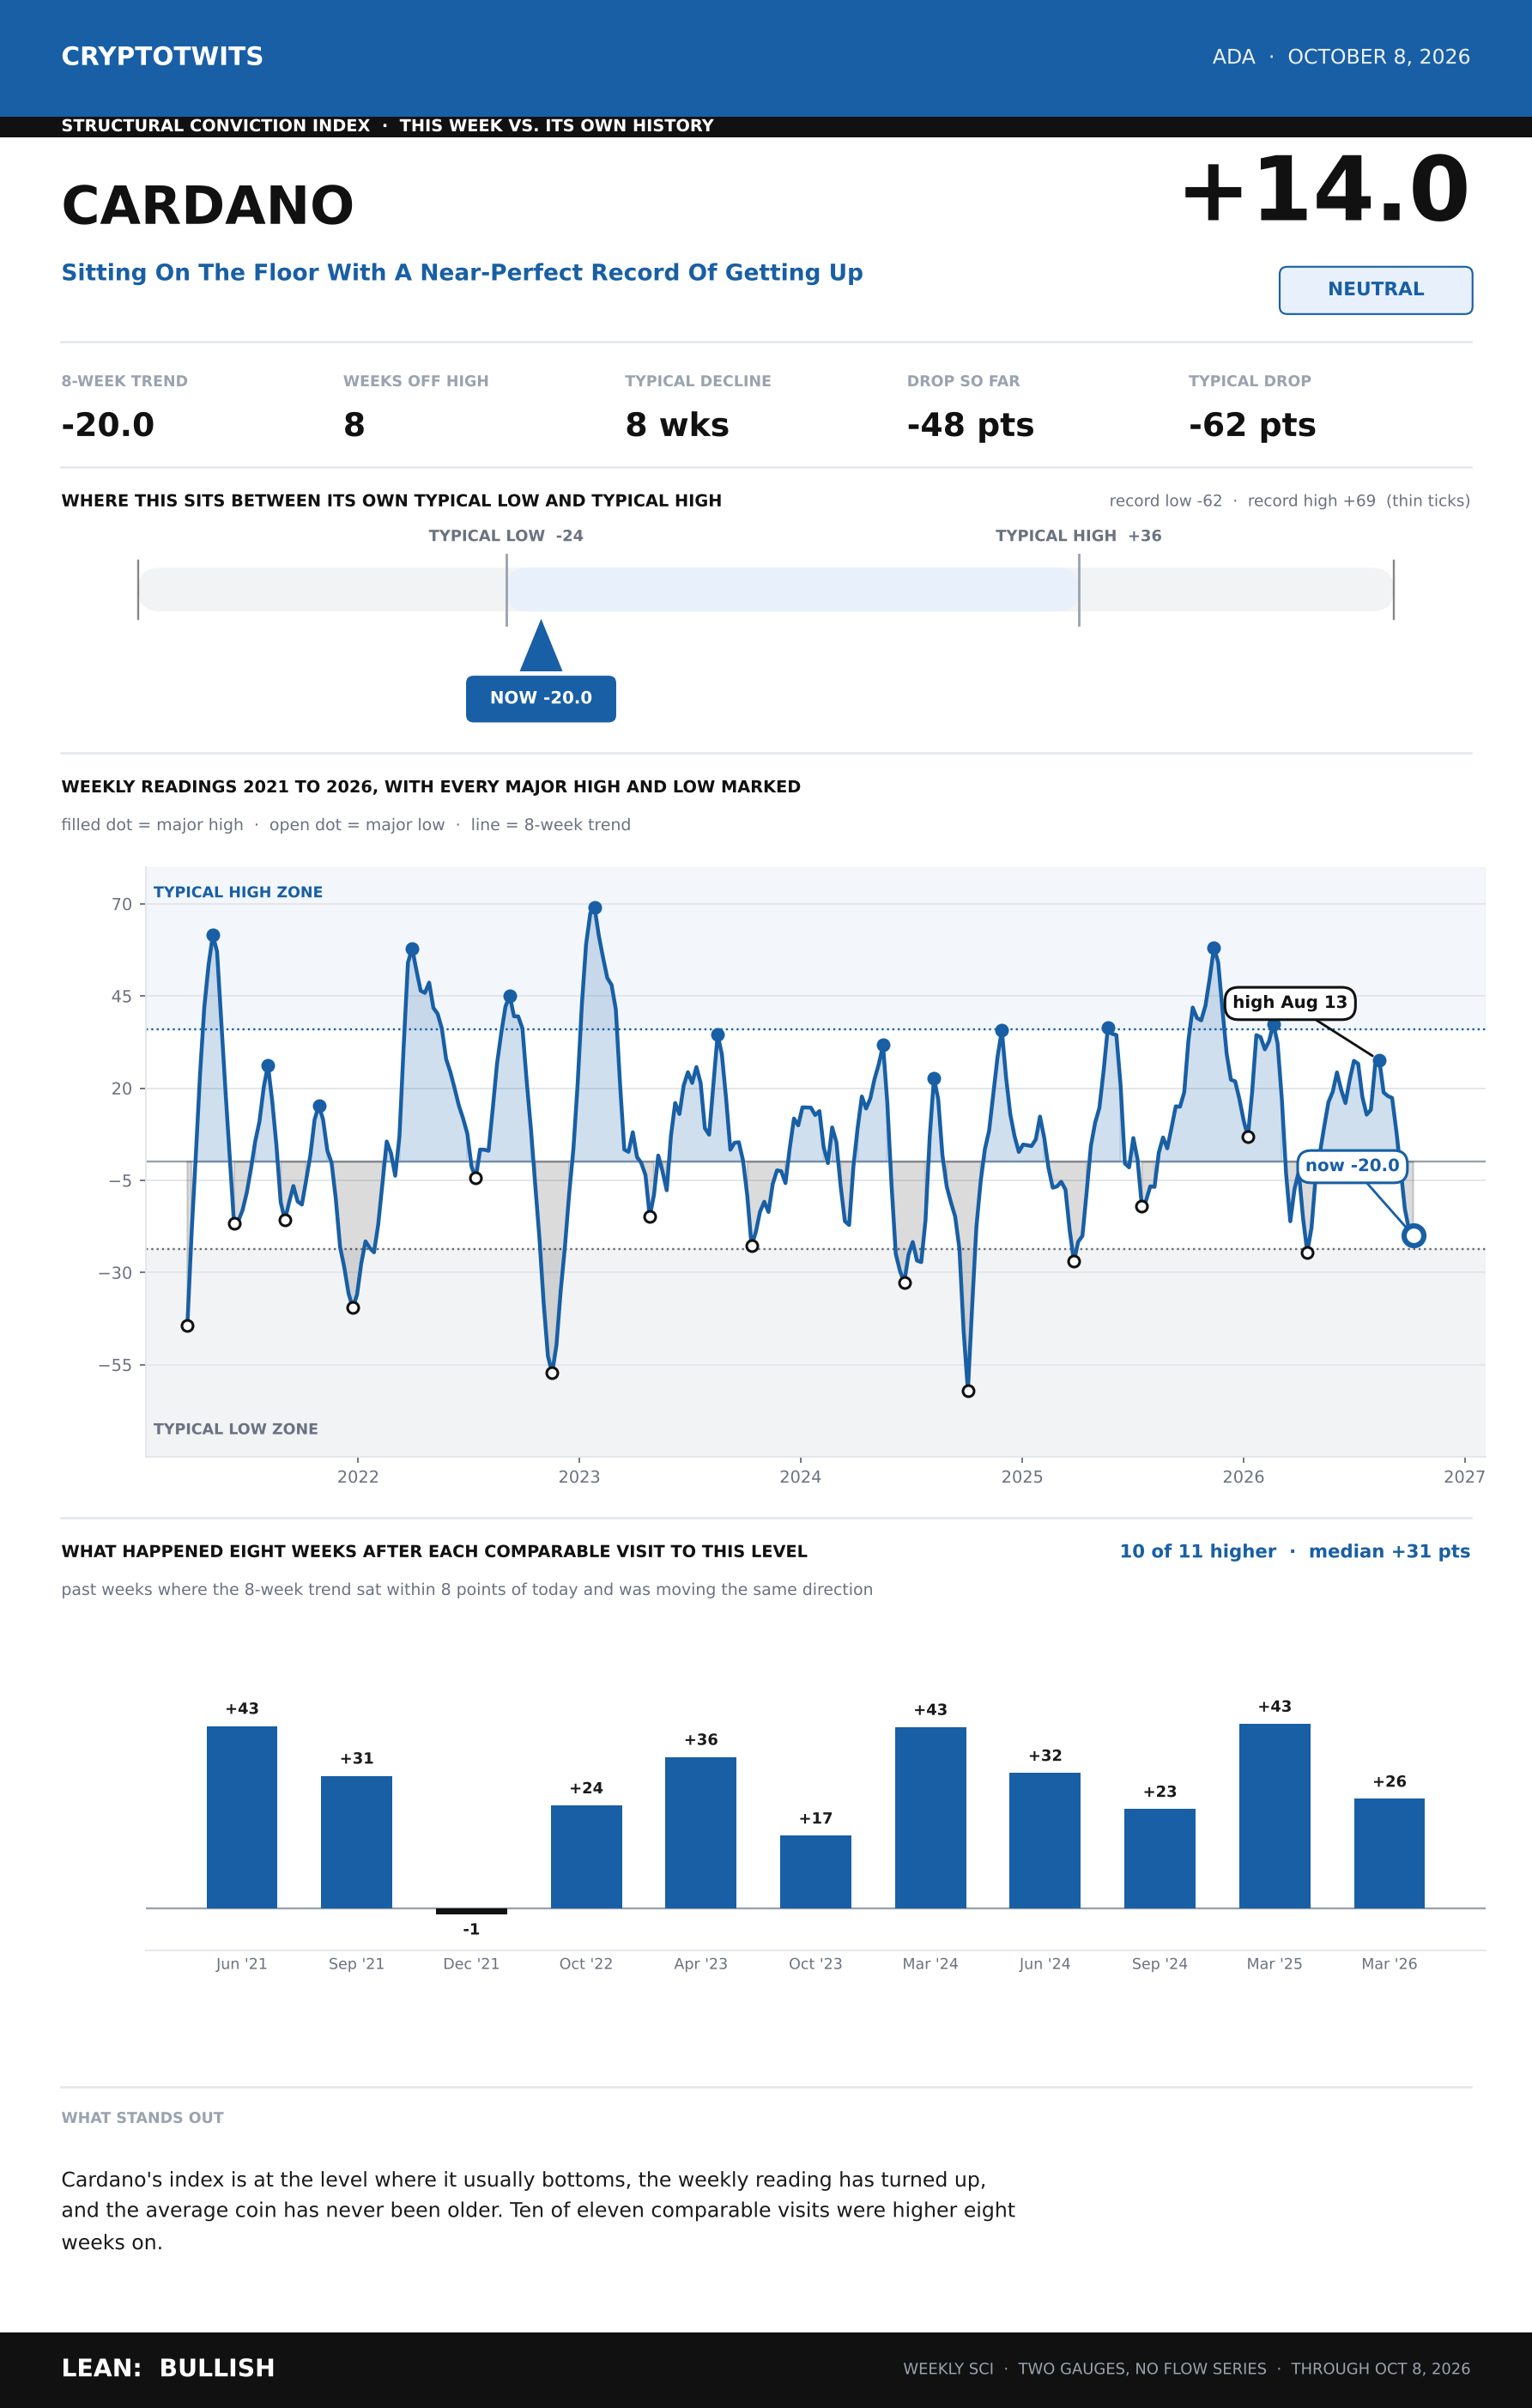
Cardano topped in mid-August and fell eight weeks, which is exactly how long a Cardano decline usually takes. It stopped at the level where Cardano usually stops. If this were a train it would have arrived to applause. 👏
Where It Sits
Depth of the drop: forty-seven points. Typical is sixty-two, so a touch shallow.
Current level: sitting on the typical low, nearly to the point.
Last two weeks: the raw reading turned positive again after three ugly ones.
Only about one week in nine has ever read this low. It is not a comfortable place, and that's the appeal. Well, at least for me, I just love pain.
What The Comparables Say
Eleven past weeks had the index down here and falling. Ten were higher eight weeks later, and the typical gain was thirty-one points. The one miss was a shrug, not a disaster.
Underneath, the average Cardano coin set a new all-time age record this week. It set the previous one last week. Supply keeps climbing the ladder into the biggest wallets while every band from a hundred $ADA ( ▲ 2.67% ) to a million keeps shrinking, which has been true for a year and reads less like distribution and more like consolidation. Coins are aging, which is the gauge doing the lifting. Concentration is the drag, but it's a mild one.
Two gauges, no exchange flow series, same caveat as always. Within that limitation this is as clean a floor setup as the index produces. Bulls likely looking here for opportunities. Bears have the clock against them. ⏰
Lean: Bullish
ON-CHAIN ANALYTICS
Uniswap: A Full Year Without A Real High, And The Flattest Range Ever 🦄
Click to enlarge.
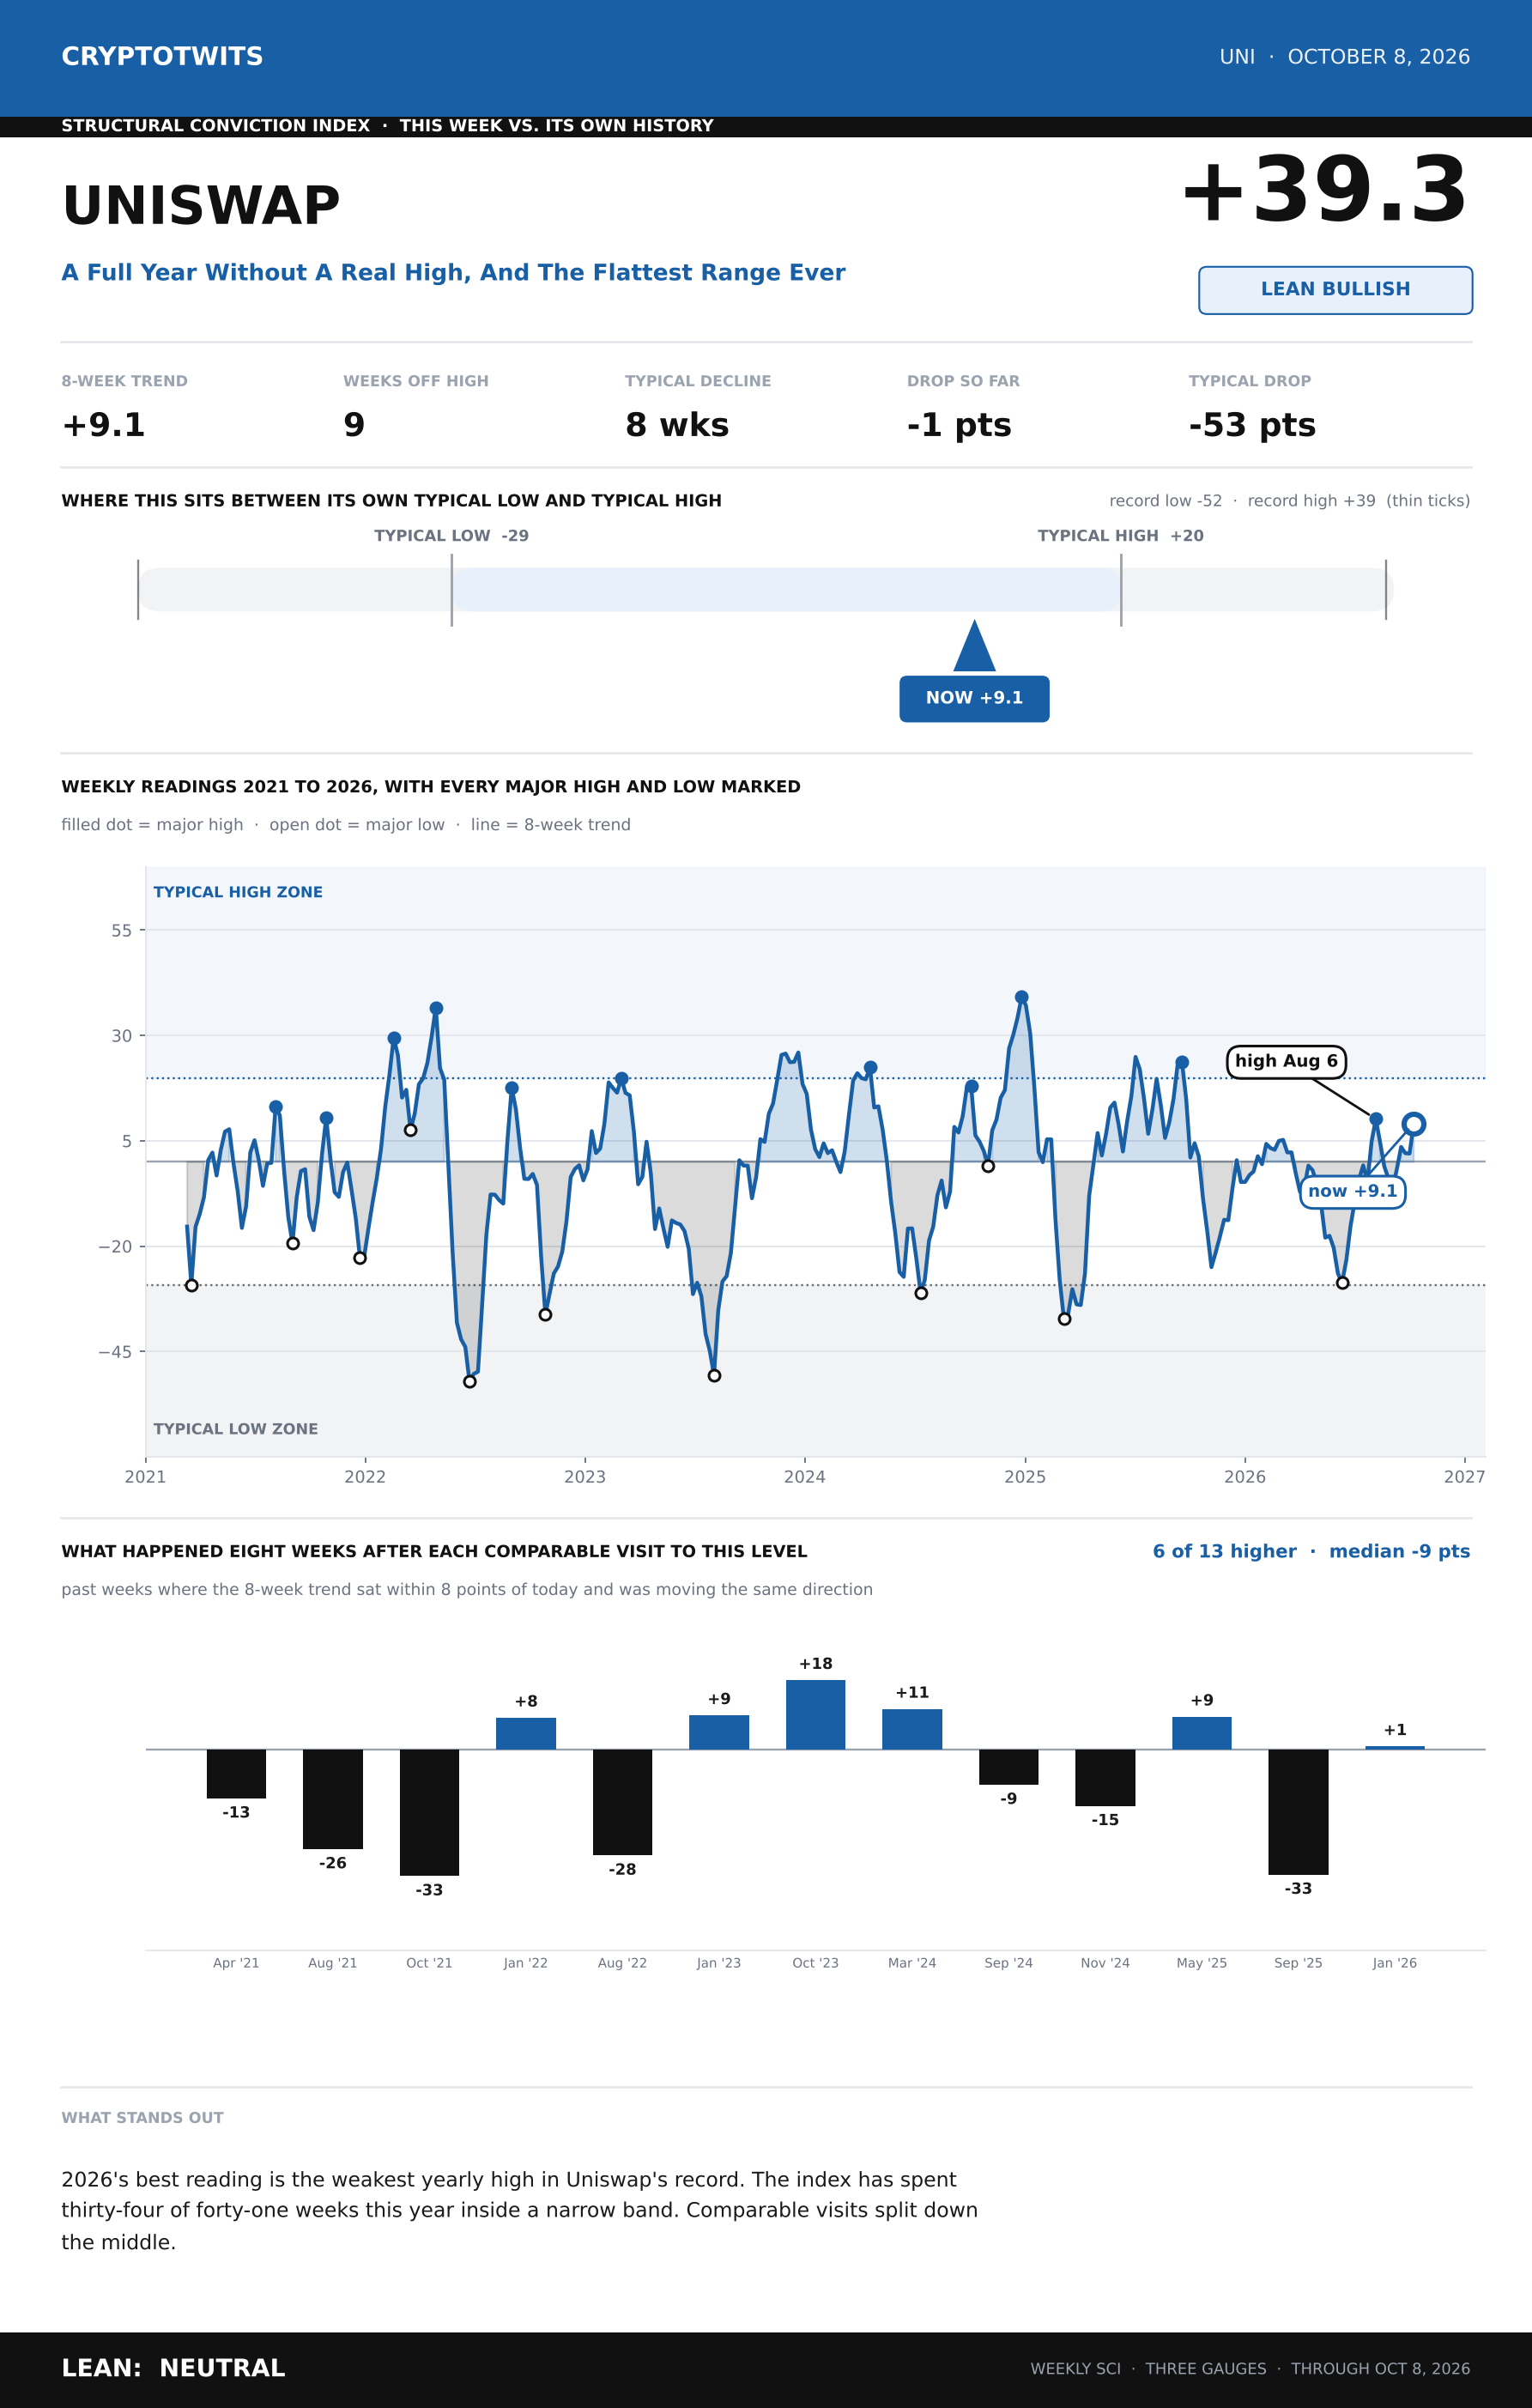
Uniswap has not had a real high all year. I don't mean a weak one. I mean the best reading 2026 has produced is the worst yearly best in the entire record, and it isn't close. 😐
Where It Sits
2026's high: ten points above zero. Every other year managed at least twenty-six.
Weeks inside a narrow band this year: thirty-four out of forty-one.
Last swing: a nine-week-old high so small it barely registered as one.
The index is a flatline with occasional hiccups. This week's raw reading jumped to nearly forty, driven by whales grabbing share and coins leaving exchanges, and the eight-week trend barely noticed.
What The Comparables Say
Thirteen past weeks looked like this. Six were higher eight weeks later, seven were lower, typical outcome a nine-point slide. Flip a coin. Then flip it again because you didn't like the answer.
The structure underneath is the same story as last month, just less noisy about it. Coin age is drifting down. Five million $UNI ( ▼ 0.6% ) moved onto exchanges over the past month even though this week ran the other way. The biggest wallets have been shedding share for a year and only this week decided to buy some back.
Uniswap's index spends most of its life arguing with itself, and this year it ran out of things to argue about. There's no setup here, bullish or bearish. There's a token waiting for someone to care. 🥱
Lean: Neutral
ON-CHAIN ANALYTICS
Aave: The Rally Stalled Halfway And All Three Gauges Went Red 🚨
Click to enlarge.
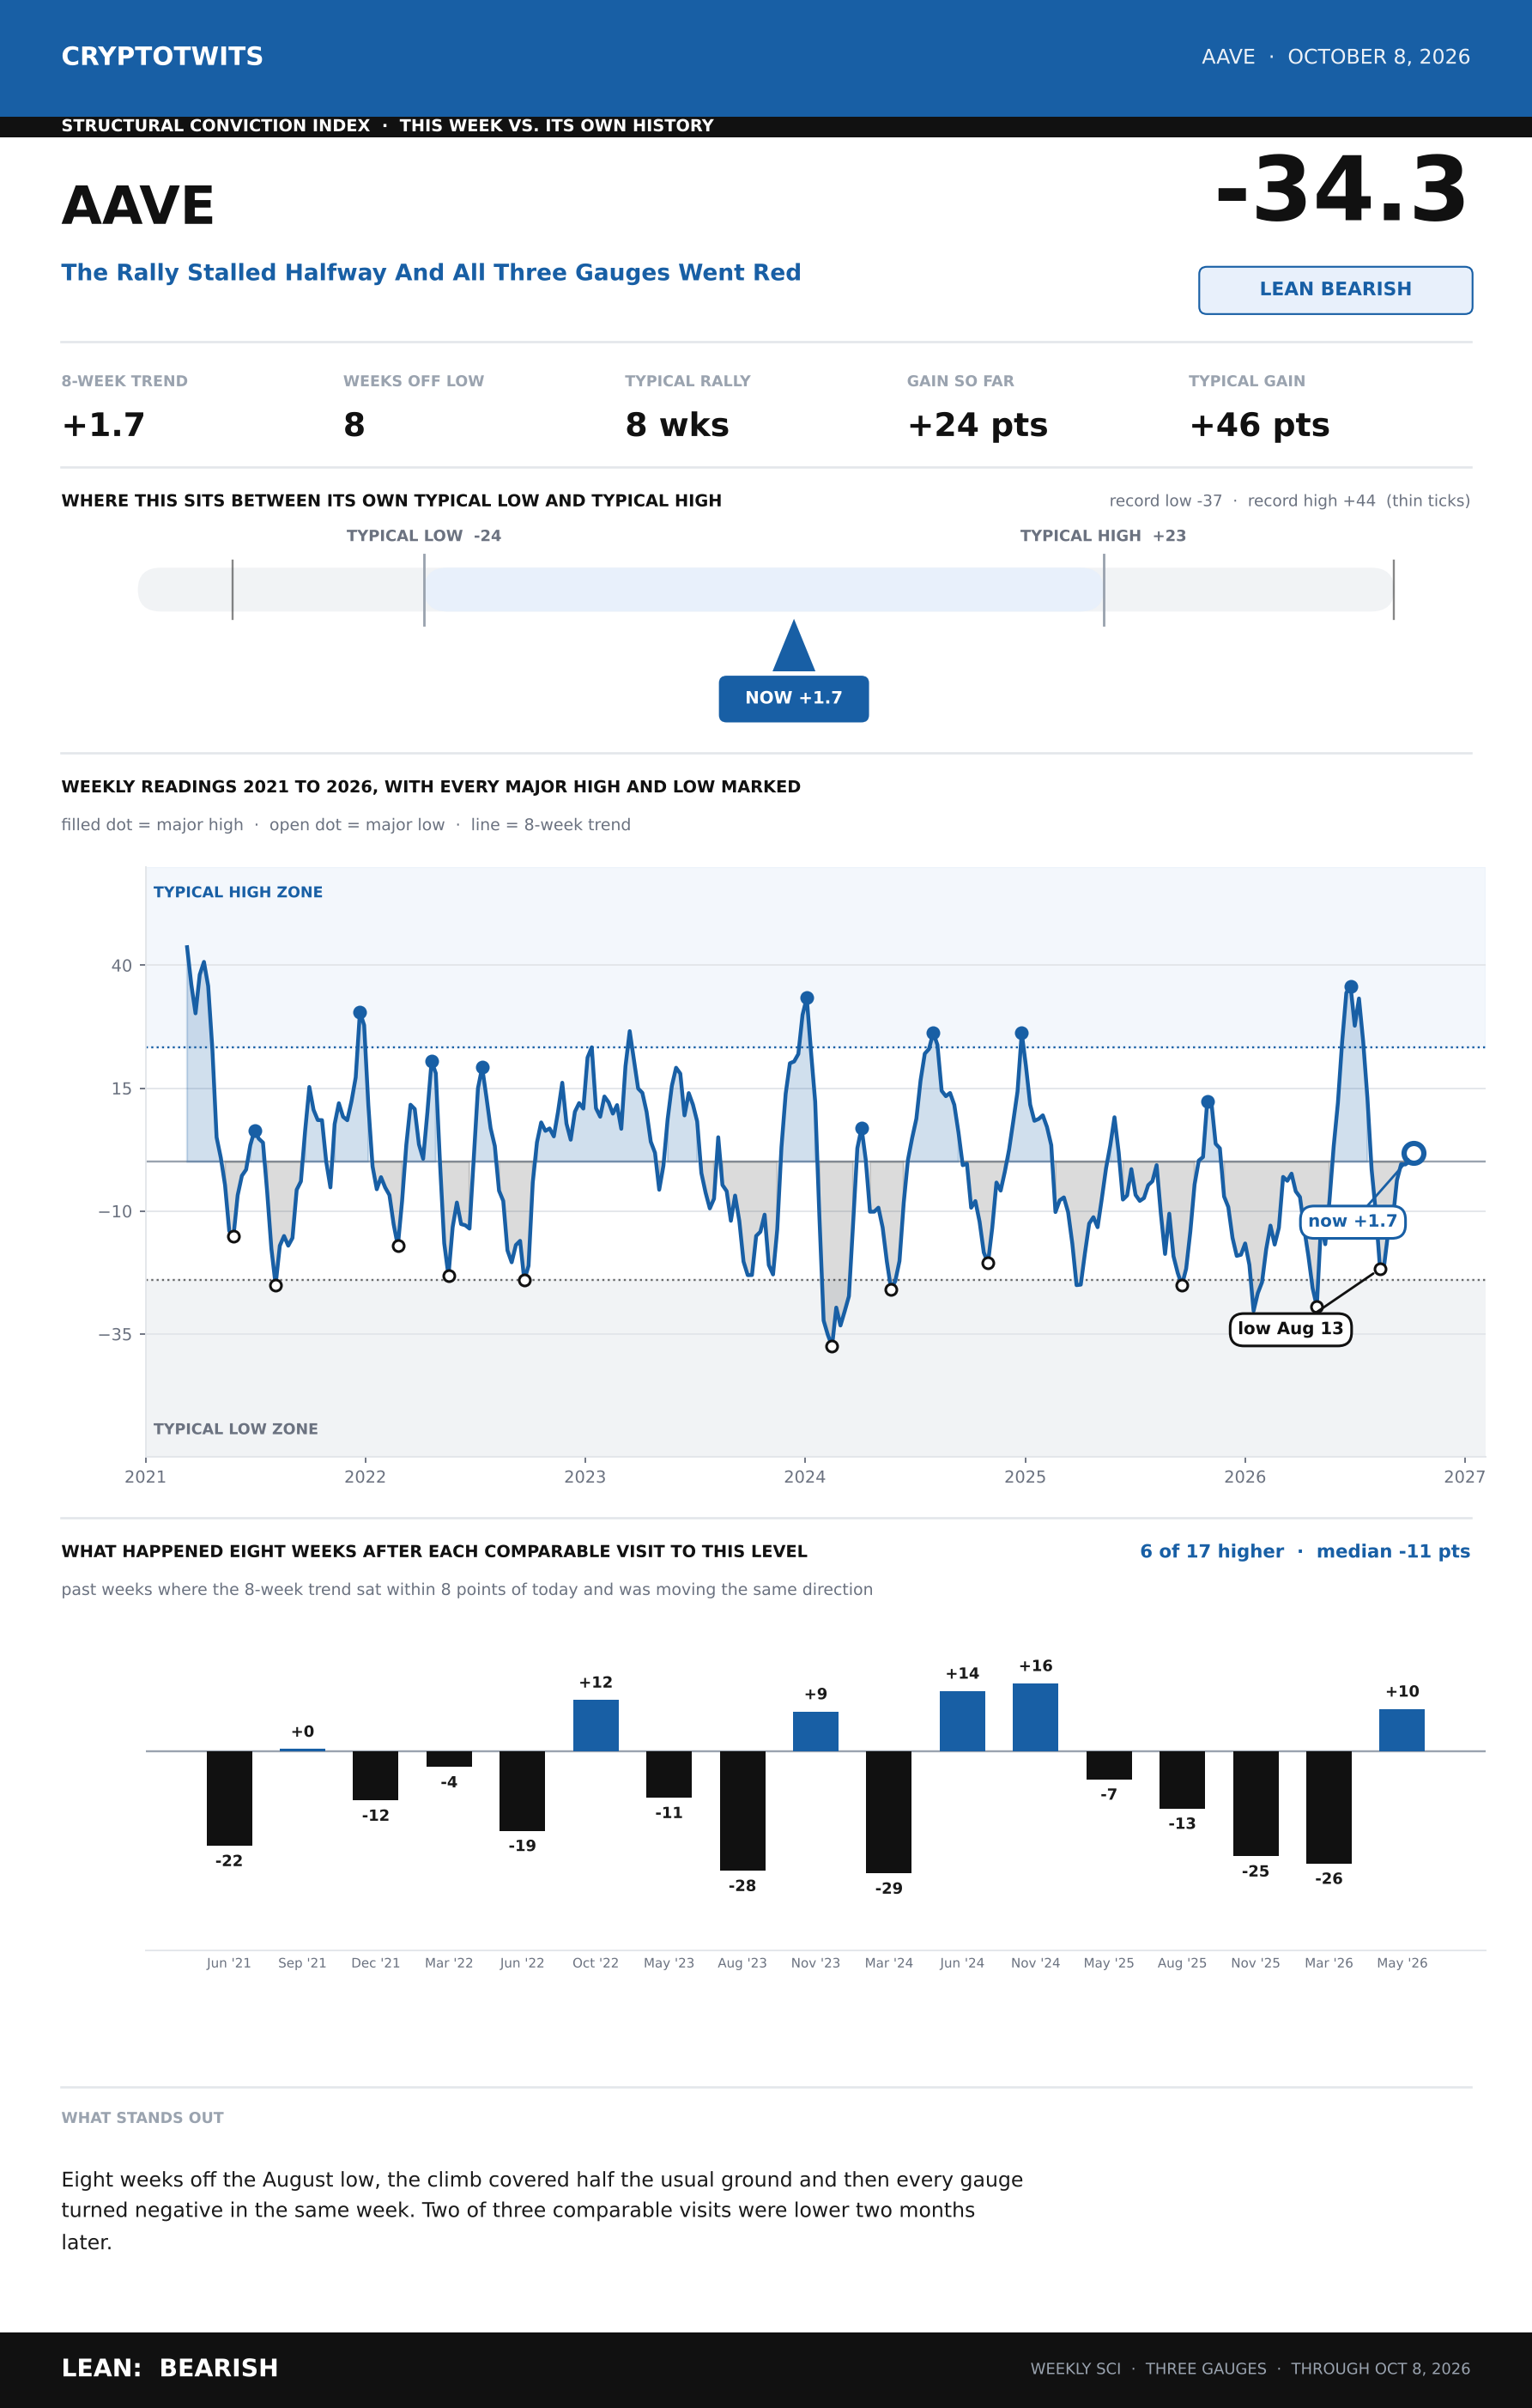
$AAVE ( ▲ 0.07% ) bottomed in mid-August, climbed for eight weeks, and ran out of fuel at exactly the halfway mark. Then this week all three gauges turned negative together. ⛽
Where It Sits
Gain since the low: twenty-three points. A normal rally manages forty-six.
Weeks elapsed: eight, which is a full rally's worth of time.
Current level: a hair above zero, well short of the typical high.
Nine of ten past rallies covered more ground. This one got halfway up the hill, sat down, and started asking about the shuttle.
What The Comparables Say
Seventeen past weeks had the trend near zero and rising. Eleven were lower eight weeks later, typical outcome an eleven-point drop. Not a catastrophe, just the slow leak of a rally that never had conviction.
Coins got younger at a fast clip. Exchange flows went to inflows. The biggest wallets shed share. All three pointing down in the same week is something Aave has done in roughly one week out of ten over six years, and it almost never marks a bottom.
The largest wallet bands I track went from about half of supply a year ago to two thirds now, most of that jump happening between October and March. That's a structural shift in who holds this token, not a weekly signal, and it changes what "whales shedding" means going forward. 🐳
Lean: Bearish
Get In Touch 📬
Email me, Jonathan Morgan, feedback; I’d love to hear from you. 📧
Follow me on Stocktwits 🫂 And Sponsor this newsletter 😎
|
Get the app Real-time alerts, live earnings calls, your personalised feed - the best experience is on mobile.
|


Terms & Conditions 📝
Securities Disclaimer: STOCKTWITS IS NOT A TAX ADVISOR, BROKER, FINANCIAL ADVISOR OR INVESTMENT ADVISOR. THE SERVICE IS NOT INTENDED TO PROVIDE TAX, LEGAL, FINANCIAL OR INVESTMENT ADVICE, AND NOTHING ON THE SERVICE SHOULD BE CONSTRUED AS AN OFFER TO SELL, A SOLICITATION OF AN OFFER TO BUY, OR A RECOMMENDATION FOR ANY SECURITY. Trading in such securities can result in immediate and substantial losses of the capital invested. You should only invest risk capital, and not capital required for other purposes. You alone are solely responsible for determining whether any investment, security or strategy, or any other product or service, is appropriate or suitable for you based on your investment objectives and personal and financial situation. You should also consult an attorney or tax professional regarding your specific legal or tax situation. The Content is to be used for informational and entertainment purposes only and the Service does not provide investment advice for any individual. Stocktwits, its affiliates and partners specifically disclaim any and all liability or loss arising out of any action taken in reliance on Content, including but not limited to market value or other loss on the sale or purchase of any company, property, product, service, security, instrument, or any other matter. You understand that an investment in any security is subject to a number of risks, and that discussions of any security published on the Service will not contain a list or description of relevant risk factors. In addition, please note that some of the stocks about which Content is published on the Service have a low market capitalization and/or insufficient public float. Such stocks are subject to more risk than stocks of larger companies, including greater volatility, lower liquidity and less publicly available information. Read the full terms & conditions here. 🔍
Author Disclosure: The author of this newsletter holds positions in AVAX, ADA, PUDGY, WLD, NEAR, INJ, LTC, LINK, ZEC, XLM, and FET. 📋