Presented by

OVERVIEW
This Is Basically The Swamp Of Sadness And We're All Artax 🐴
Here’s What’s Happening 👇
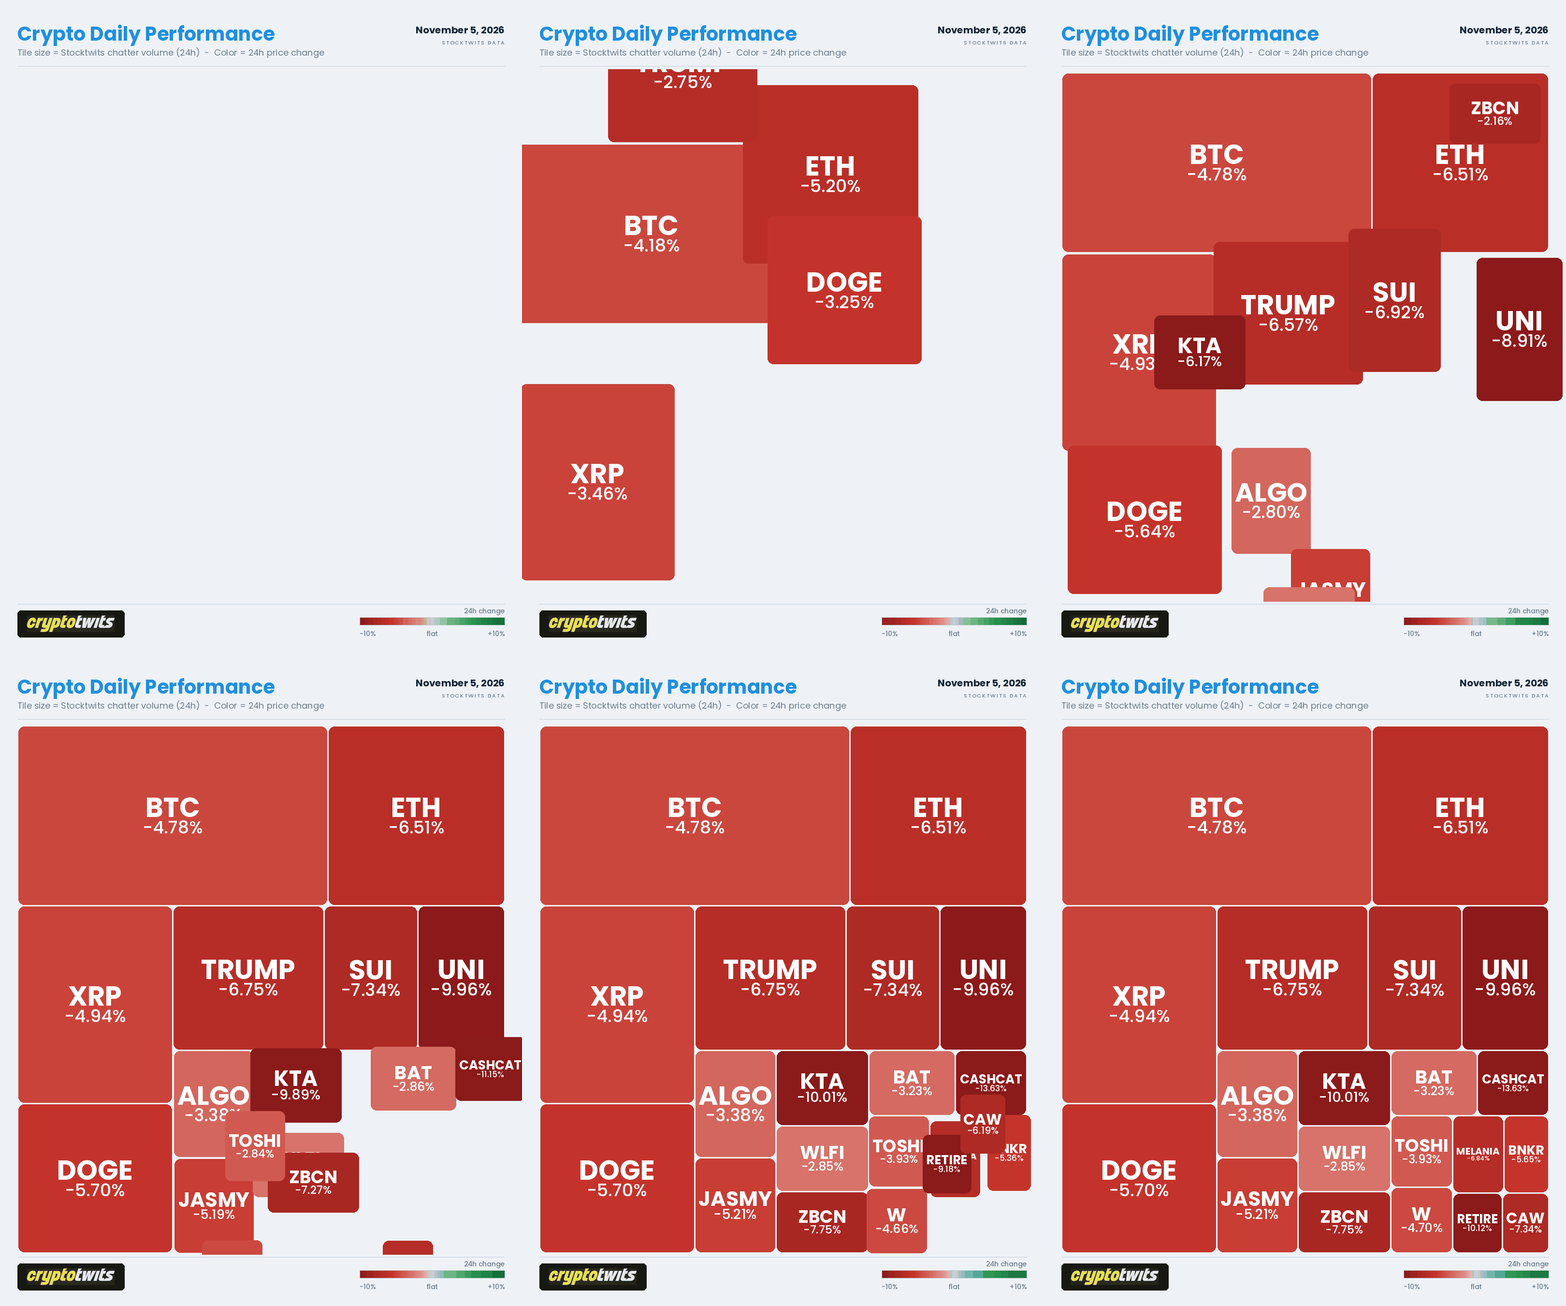
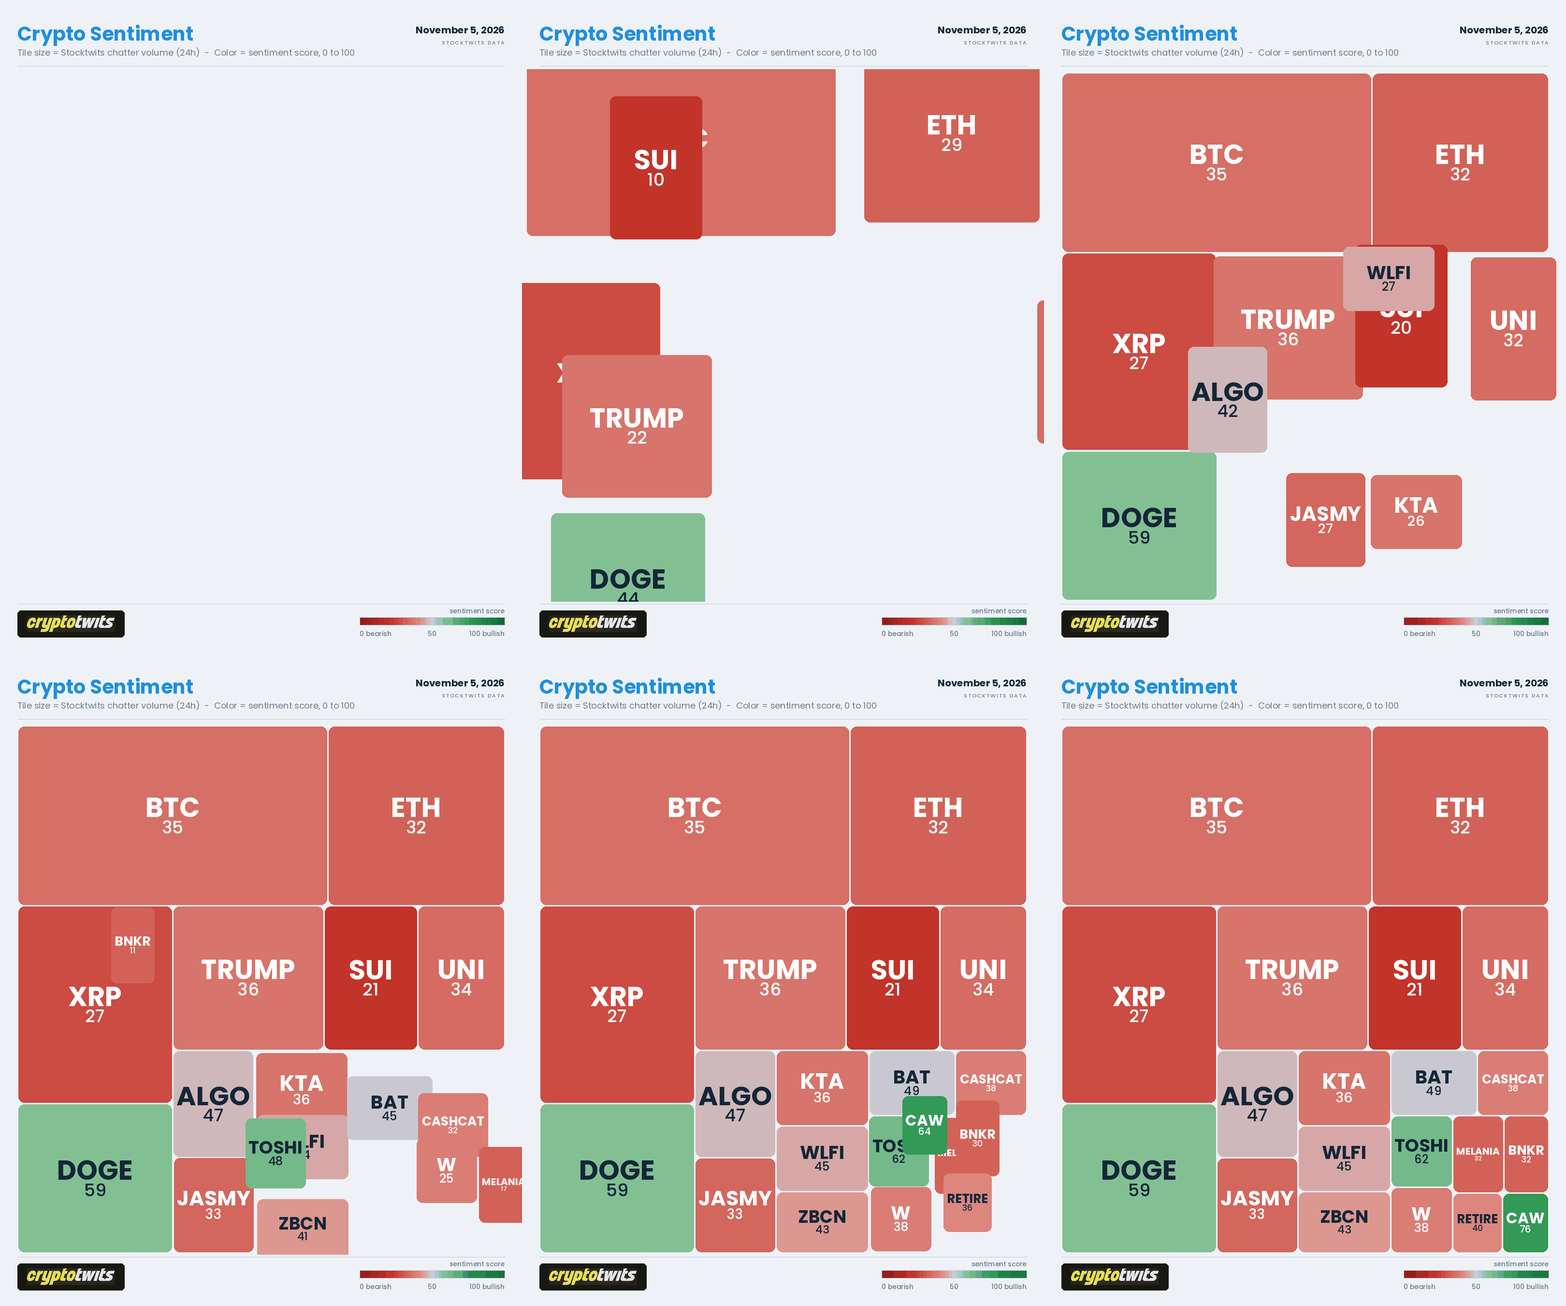
OVERVIEW
Spent Out Profit Ratio 🧠
Bitcoin's down to $76,000 today and the market's bleeding with it, so this issue is all about one on-chain number that's been waving a red flag for a week: the Spent Output Profit Ratio, or SOPR. 🚩
SOPR takes every coin that moved on-chain in a day and compares the price it went for against the price it last moved at. Picture knowing whether every house sold on your street today went for more or less than the owner paid. Above 1, sellers are booking profits. Below 1, they're eating losses. Right at 1, they're getting out even.
Why should a trader care? Because of how people behave at break-even. In bull markets, holders refuse to sell at a loss, so SOPR dips to 1 and bounces. In bear markets, folks stuck underwater for months bail the second they're whole, so SOPR rallies to 1 and gets swatted. Big spikes mark heavy profit-taking. Deep plunges mark capitulation. 🔍
SPONSORED BY ALUMNI VENTURES
Invest in High-Potential Startups Like These

Alumni Ventures is giving readers early access to high-potential startup opportunities across today’s most active sectors, co-invested alongside name-brand VC firms like Andreessen Horowitz (a16z), Bessemer, & Y Combinator.
You get:
Curated deal flow of high-potential startups
Invest alongside well known lead venture firms in these deals
No cost to see deals
No obligation to invest
*3rd Party Ad. Not an offer or recommendation by Stocktwits. See disclosure here.
ON-CHAIN ANALYTICS
Bitcoin's Break-Even Line Is Cracking 🧊

$BTC ( ▼ 5.95% )’s SOPR printed under 1 on five of the last six days, and the 7-day average just slipped under break-even for the first time since August. Today's 5.5% drop to $76,000 won't help. 📉
How unusual is that? Depends which year you ask.
In 2025, the SOPR sat above 1 on 83% of days, including a 157-day unbroken streak from April to September while BTC ran from $84,000 to $123,000. Profit-taking pushed it past 1.03 on 28 separate days. In 2026, it's been below 1 on 57% of days and hasn't cleared 1.03 once. Its longest run above 1 this year lasted 27 days.
A few things to watch:
The top tell. After the 157-day streak snapped in September 2025, dips under 1 started showing up every few weeks. Each one got bought within three days. The first four were all lower 30 days later. This Fall's dips are coming faster: Sept. 15, Oct. 14, Oct. 24, Oct. 29.
The bear setup. Five straight days under 1, coming off an uptrend, showed up in two stretches - December 2025 and late May 2026. Two months after each signal, BTC was 12% to 25% lower.
The bull trap. Five straight days above 1 inside a downtrend looks like a bottom. In 2026 it was a trap three times out of four, with BTC down 24% to 28% within a month. The April 2025 turn looked different: SOPR's deepest print of the year, then 157 days without a print under 1.
Bulls want SOPR back above 1 fast, the way it bounced in September. If it stalls at 1 instead, break-even's turned into a ceiling, and bears will likely be happy. 🐻
ON-CHAIN ANALYTICS
ETH Hodlers Have Spent Most Of 2026 Underwater 🤿

Ethereum got hit harder than Bitcoin today, sliding 7.4% to $2,244. Its SOPR is also a step ahead of Bitcoin's on the way down. ETH's 30-day average slipped under 1 on Oct. 30, and the five-straight-days-under-1 signal from the Bitcoin piece already fired on ether back on Oct. 18. ETH's lost another 7% since. 🥊
The bigger story is how much time $ETH ( ▼ 8.69% ) holders spend in the red. SOPR sat under 1 on 46% of days in 2025 and 77% of days in 2026, against Bitcoin's 17% and 57%. Bitcoin's longest losing streak in that stretch was 13 days. Ethereum's ran 62, from mid-May to mid-July this year - more time underwater than the crew in The Abyss.
The two did share one date. ETH's best run, 82 straight days above 1, carried it from $2,572 to its $4,832 record close. It ended Sept. 21, 2025, the same day Bitcoin's 157-day streak died.
For traders, the ETH data says two things:
Don't port the Bitcoin rules. The five-day signal that's been clean on BTC is a coin flip on ETH. It nailed February 2025, with ether down 42% two months later. Then it fired in late June 2025 and ETH ran 90% over the next two months.
Ethereum's bottoms took six weeks. Ether's SOPR has plunged under 0.90 five times since January 2025. Three of those came within the first two weeks of a losing streak and went nowhere or lower over the next month. The two that hit roughly six weeks into an unbroken streak landed within two days of ether's 2025 and 2026 lows. Both were up more than 50% two months later.
So where's ETH now? Under 1 on 21 of the 34 days this quarter, with the latest losing streak just two days old. Bears have the 30-day average on their side. Bulls hunting the next big flush need six ugly weeks first. ⏳
STOCKTWITS
Hey, We Have A Forex Newsletter Now 😱
Written by yours truly. Super data heavy. Right up your alley. 👀

Subscribe!
It’s once a week, on Mondays. Let me know what you think! 👇
ON-CHAIN ANALYTICS
XRP Went From Best To Worst 🎢

XRP dropped 5.6% to $1.23 today, and the on-chain picture behind it is grim. SOPR has printed under 1 on 28 of 34 days this quarter, and the 30-day average sits at 0.96. 💀
Next to Bitcoin and Ethereum, $XRP ( ▼ 7.42% ) had the biggest personality swing. In 2025, its SOPR sat under 1 on just 15% of days, the fewest of the bunch, while XRP ran to a record. In 2026, it's 83%, the most. Its longest run above break-even this year? Six days. From May 10 to Aug. 19, SOPR spent 100 of 102 days underwater.
Fair warning before the patterns: XRP's SOPR is twitchy. A typical daily reading sits six times further from 1 than Bitcoin's, so single prints mean less here and streaks mean more.
Profit spikes have been exits. Seven of the eight times XRP's SOPR spiked above 1.25 since January 2025, price was lower a week later. The lone exception, July 4, 2025, kicked off the run from $2.22 to the $3.55 record close.
Bitcoin's bear setup travels. Five straight days under 1 coming off an uptrend has fired four times on XRP since November 2025, and all four were lower two months later, by 12% to 30%. Ether can't say that.
Flushes haven't marked the lows. SOPR has crashed under 0.80 four times in 2026, and XRP was lower a month later after each of the three with a full month of data. The 2026 bottom showed up quieter: XRP closed at $0.99 on Aug. 16, the losing stretch ended three days later, and XRP hit $1.57 by Sept. 22.
Two of those flushes landed since mid-September. Bulls want them to stop and the SOPR to string together more than six days above 1. Until then, bears are running the place. 👑
ON-CHAIN ANALYTICS
Solana Plays by Bitcoin's Rules, Mostly 📜

$SOL ( ▼ 6.53% ) dropped 6.4% to $89.45 today, and its SOPR has been under 1 for 13 straight days, back to Oct. 22. That matches Bitcoin's longest losing streak of the entire year. For Solana it's barely a warm-up: four of its 2026 losing streaks ran 31 to 48 days. 🏃
Out of all the tickers in today's issue, SOL's SOPR looks the most like Bitcoin's. Its daily readings swing about 1.5 times as much as BTC's, against four times for ether and six for XRP. It even shares the date: SOL's best run since January 2025, 34 straight days above 1, died Sept. 21, 2025, the same day as Bitcoin's and ether's. That date's cursed.
So, how do Bitcoin's rules hold up on Solana?
Five straight days under 1, coming off an uptrend: works, and faster. Seven of eight signals were lower two weeks later, with a median drop of 10%. It fired again on Oct. 11. SOL's down 20% since.
Five straight days above 1 inside a downtrend: the opposite of Bitcoin. On BTC, that one was a trap. On SOL, it worked three times out of four, with SOL up 16% to 17% a month later. The miss came in January 2026, when SOL dropped 37% instead.
The flush: nailed it to the day. SOL's deepest SOPR print since January 2025, 0.918, landed on June 6, 2026, the exact day SOL bottomed at $62.15. A month later SOL was up 16%, and it's still 44% above that low today.
Bulls need five straight days back above 1 to flip the setup their way, and the 30-day average is already under 1, so the downtrend condition is there. Bears have the calendar on their side. If this losing streak runs like SOL's four longest did this year, it has weeks to go. 🗓
STOCKTWITS
It’s Getting Cold. Stocktwits Has A Hawt Anthropic IPO Hoody. 👍

ON-CHAIN ANALYTICS
Uniswap Holders Are Cashing Out 💸

Well, $UNI ( ▼ 12.75% ) got smacked -10.6% today to $6.81, the worst day of anything in this issue. To see why that stings particularly hard for Uniswap, rewind the year. ⏪
Dec. 29, 2025. UNI's SOPR drops under 1 and stays there for 131 straight days, every single day of the first quarter included. UNI basically spent the first four months of 2026 in the Upside Down.
June 10. UNI bottoms at $2.39, down 84% from its January 2025 high.
Sept. 22. UNI tops at $10.22, up 327% off the low. Since July, SOPR has printed above 1 on 83 of 126 days.
Oct. 27. SOPR spikes to 1.458, the biggest profit-taking print since at least January 2025. UNI was at $7.07 by then, 31% under the peak.
The only other time UNI's SOPR printed that high was Sept. 11, 2025, at 1.454, with UNI right around $10. It fell 30% over the next month. But that’s just one instance in a limited timeframe, so treat it as a yellow flag. Or a yellow-ish flag.
The two spikes also landed in different spots. The 2025 one hit near the top, when holders were cashing out at the highs. This one came after the top, which looks like people who bought in the $2 and $3 range locking in gains while there are still gains to lock in.
Right now UNI's 30-day SOPR average sits at 1.03, the highest of any ticker in this issue. Fair warning: UNI's daily SOPR is all over the map, printing anywhere from 0.24 to 1.46 since January 2025, so the 30-day average is the number to watch.
Bulls want that average to stay above 1 while the profit-takers finish up. Bears want it to roll under, because a coin that just ran 327% has a lot of people with something to sell. 🏷
ON-CHAIN ANALYTICS
Dogecoin Holders Have Had Two Good Days All Year 🐶

Dogecoin fell 6.8% to 7.2 cents today, down 83% from its January 2025 high and just 4% above its August low. The on-chain number behind it is worse: its SOPR has printed above 1 on exactly two days in 2026. ✌
Is that a typo? Nope. $DOGE ( ▼ 8.56% )’s SOPR sat under 1 for 344 straight days, from Oct. 14, 2025 to Sept. 22, 2026. The only two profitable days, Sept. 23 and Sept. 27, came right after. On the median day this year, coins moved on-chain at a 17% loss. Bitcoin's median day was break-even.
Why didn't the rally fix it? DOGE ran 45% off its Aug. 6 low of 6.9 cents to 10 cents by Sept. 22, and SOPR stayed under 1 for all 48 days of the climb. That's the ugly part. Sellers used the bounce to get out at smaller losses instead of booking profits. Holders with a cost basis way above 10 cents are an overhang every rally has to chew through, and this one choked on it.
Does any of it this help? Some. Deep flushes have been DOGE's tell. SOPR sank under 0.65 on 24 days in March and April 2025 and again on July 7, 2026. Every one of those days was followed by a higher DOGE two months later, by 11% to 42%.
On Nov. 2, SOPR printed 0.584, its second-lowest reading since January 2025.
So is that a bottom signal? Meh, DOGE's SOPR runs further from 1 than anything else in this issue, so a single print carries less weight here than it would on Bitcoin. Bulls see a flush that has worked twice. Bears see 344 days of evidence that every bounce gets sold. 🏀
Get In Touch 📬
Email me, Jonathan Morgan, feedback; I’d love to hear from you. 📧
Follow me on Stocktwits 🫂 And Sponsor this newsletter 😎
|
Get the app Real-time alerts, live earnings calls, your personalised feed - the best experience is on mobile.
|


Terms & Conditions 📝
Securities Disclaimer: STOCKTWITS IS NOT A TAX ADVISOR, BROKER, FINANCIAL ADVISOR OR INVESTMENT ADVISOR. THE SERVICE IS NOT INTENDED TO PROVIDE TAX, LEGAL, FINANCIAL OR INVESTMENT ADVICE, AND NOTHING ON THE SERVICE SHOULD BE CONSTRUED AS AN OFFER TO SELL, A SOLICITATION OF AN OFFER TO BUY, OR A RECOMMENDATION FOR ANY SECURITY. Trading in such securities can result in immediate and substantial losses of the capital invested. You should only invest risk capital, and not capital required for other purposes. You alone are solely responsible for determining whether any investment, security or strategy, or any other product or service, is appropriate or suitable for you based on your investment objectives and personal and financial situation. You should also consult an attorney or tax professional regarding your specific legal or tax situation. The Content is to be used for informational and entertainment purposes only and the Service does not provide investment advice for any individual. Stocktwits, its affiliates and partners specifically disclaim any and all liability or loss arising out of any action taken in reliance on Content, including but not limited to market value or other loss on the sale or purchase of any company, property, product, service, security, instrument, or any other matter. You understand that an investment in any security is subject to a number of risks, and that discussions of any security published on the Service will not contain a list or description of relevant risk factors. In addition, please note that some of the stocks about which Content is published on the Service have a low market capitalization and/or insufficient public float. Such stocks are subject to more risk than stocks of larger companies, including greater volatility, lower liquidity and less publicly available information. Read the full terms & conditions here. 🔍
Author Disclosure: The author of this newsletter holds positions in AVAX, ADA, PUDGY, WLD, NEAR, INJ, LTC, LINK, ZEC, XLM, and FET. 📋
