Sponsored by

OVERVIEW
Last Week Hit Different Levels Of Nuts 😱
Here’s What’s Happening 👇
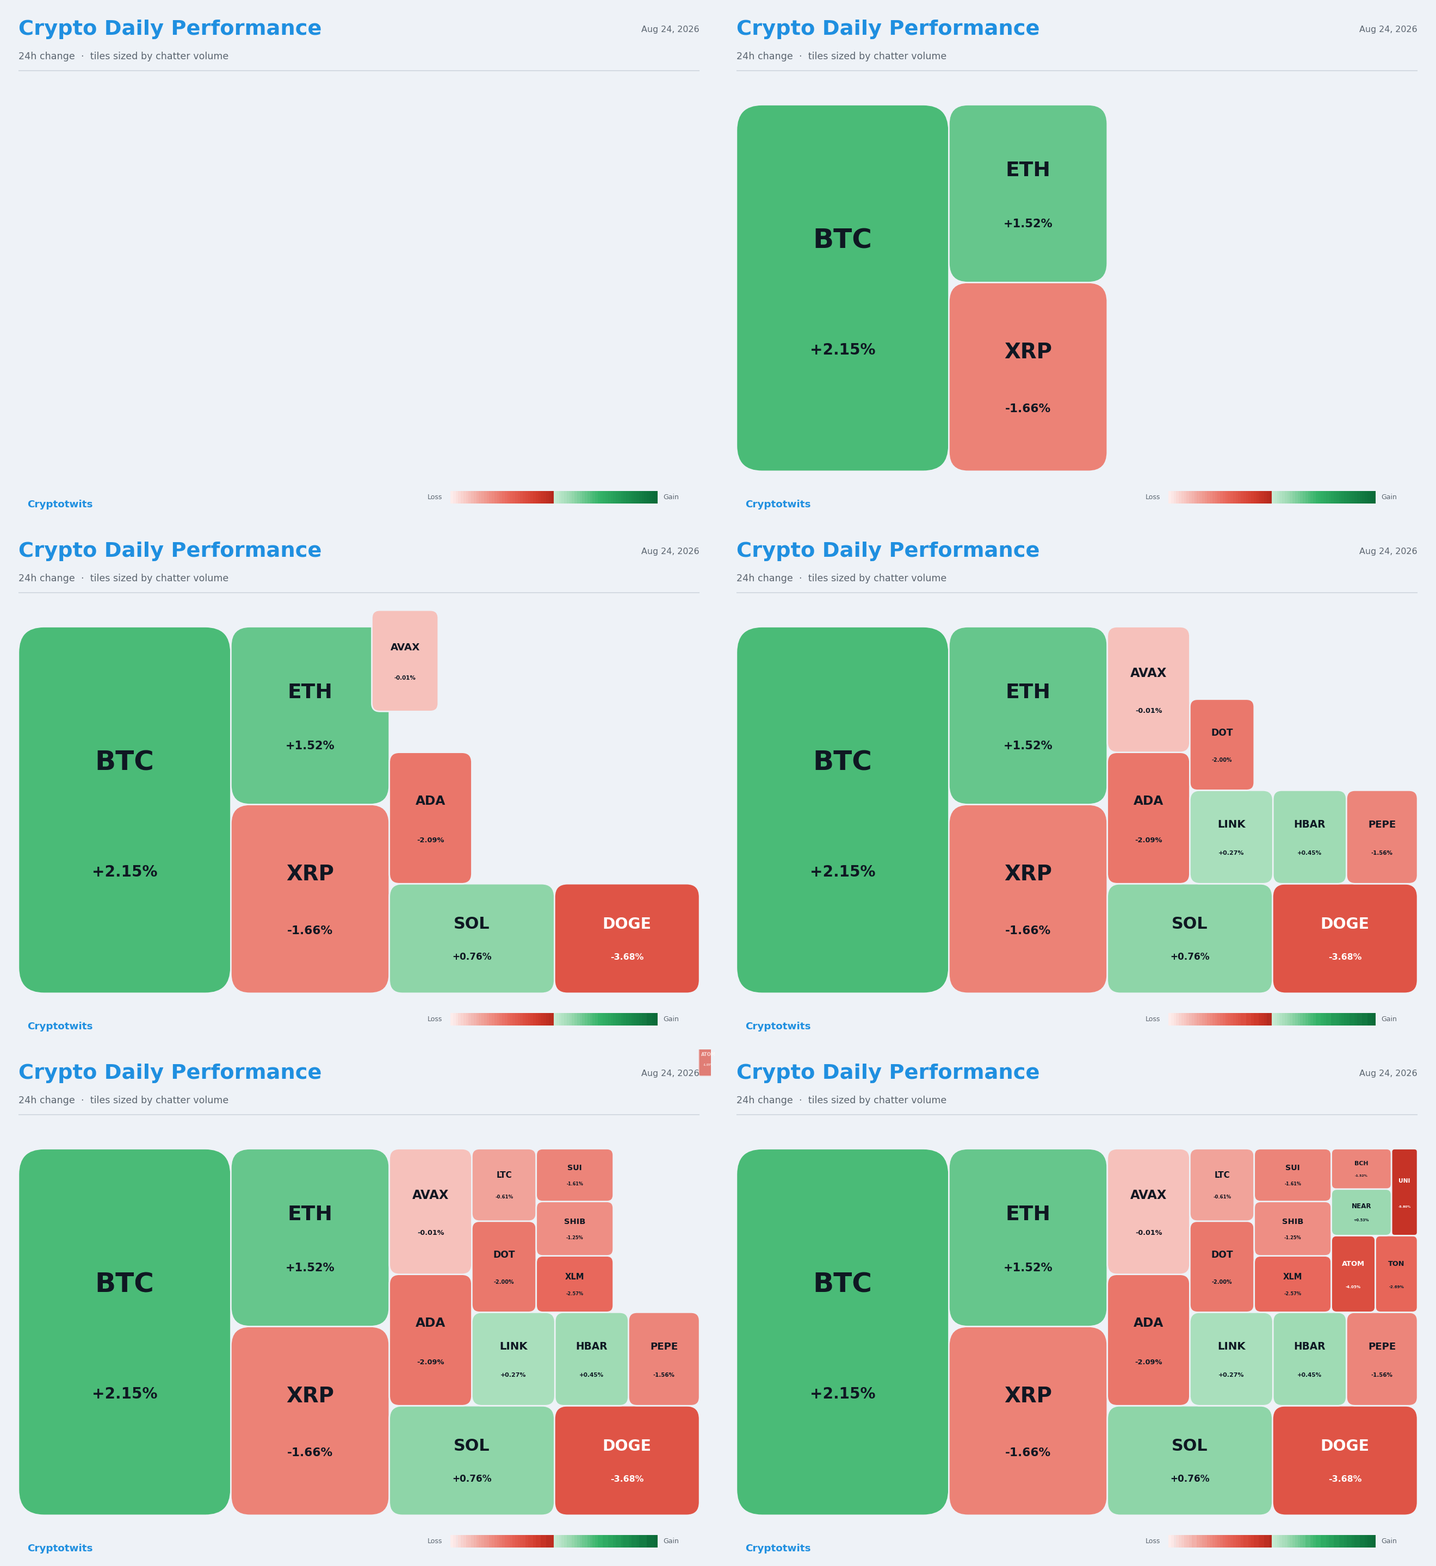
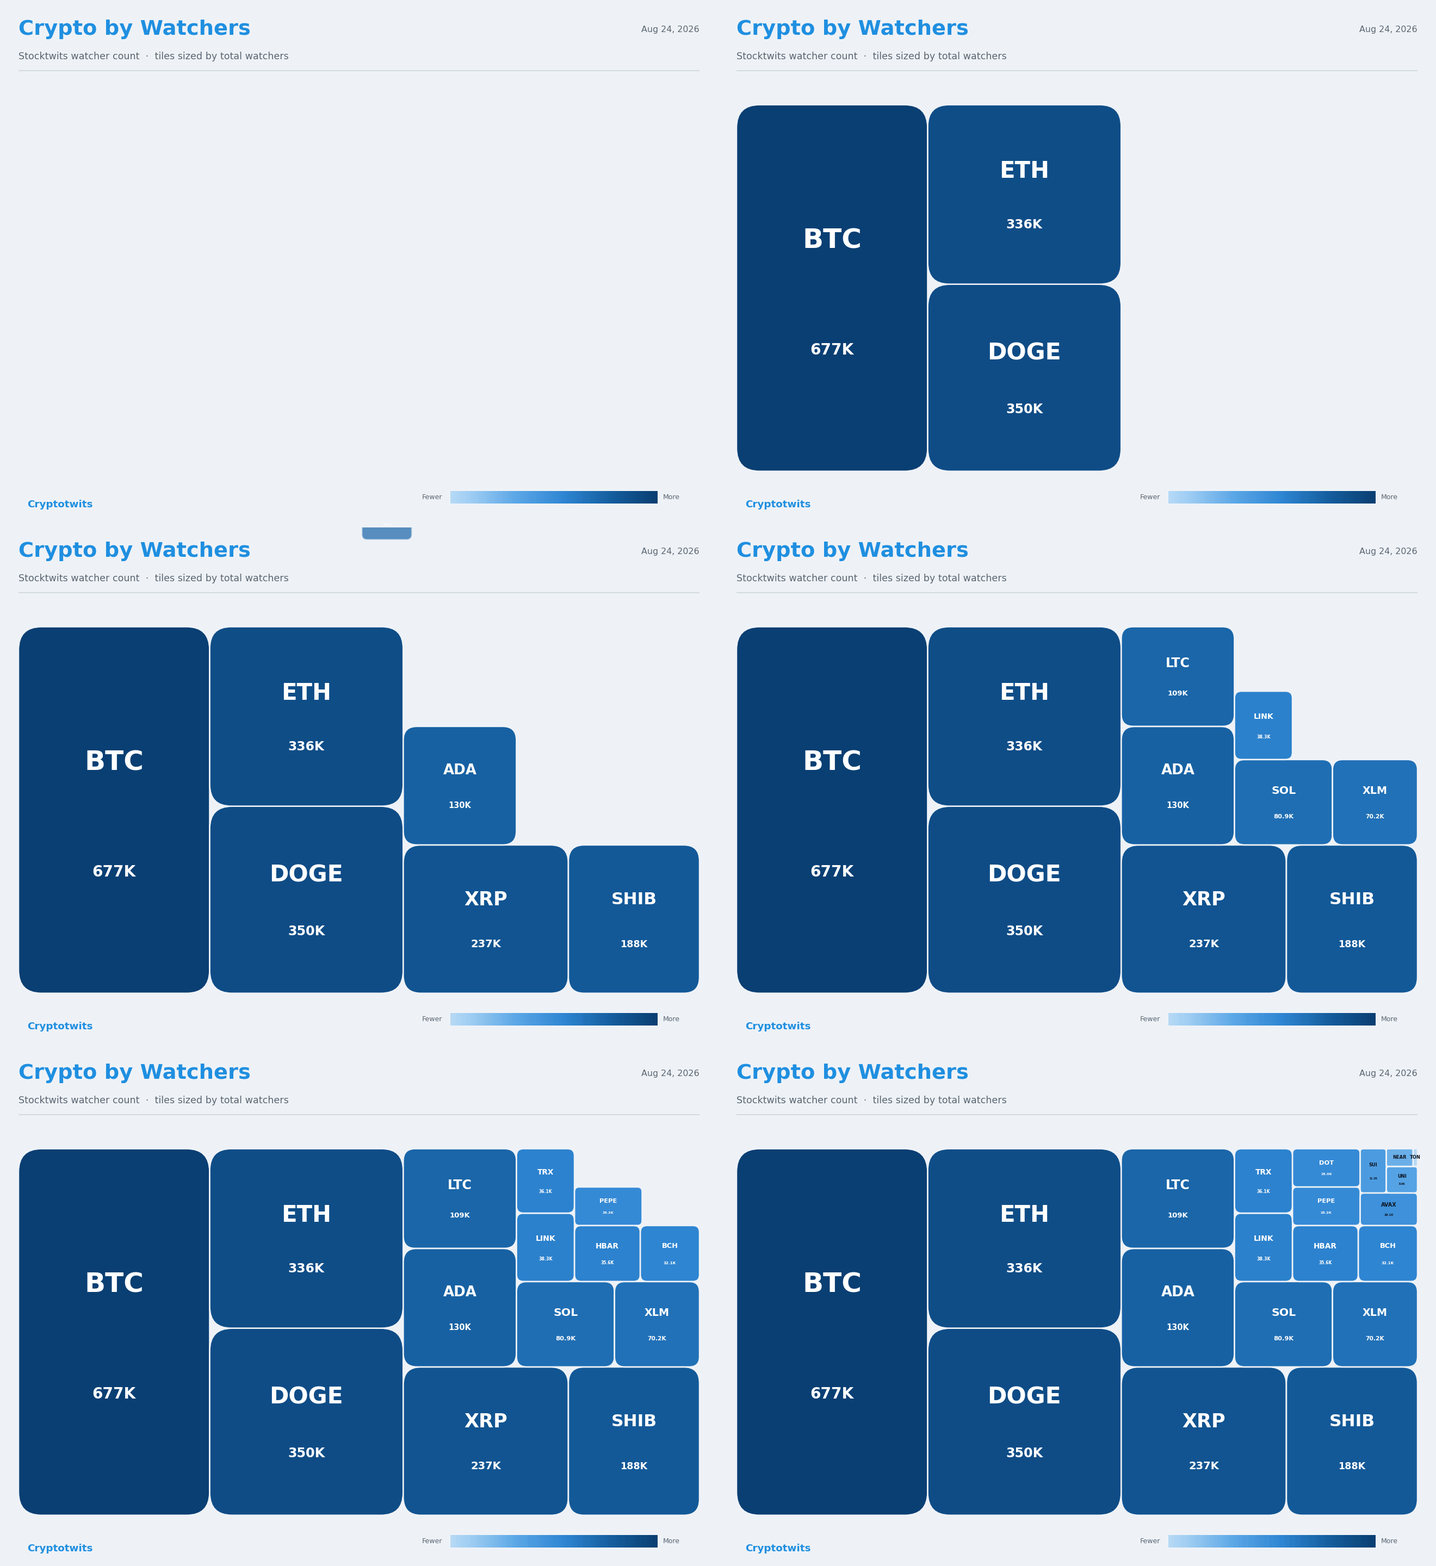
TECHNICAL ANALYSIS
Well, Last Week Was Nuts. How Nuts? Pretty Damn Nuts 🤯
Look at this list 👇

Click to enlarge.
Out of 21 crypto tickers and 1 index (altcoin index, chart used is TOTAL3ES), each closed last week somewhere in the top-10 best closes in their respective histories.
Some Crazy Numbers
$ENA ( ▼ 8.7% ) +96.4%, the best week of its two-and-a-half-year life
$ZEC ( ▼ 11.37% ) +76.2%, third-best in just under ten years, and it finished the week higher than it has ever finished a week
$AAVE ( ▼ 4.27% ) +64.6%, best in five years and nine months
$XRP ( ▼ 2.45% ) +53.2%, better than 97% of the thirteen years it has been trading
$BTC ( ▼ 1.72% ) +23.7%, best week in three and a half years
$LTC ( ▼ 4.13% ) brought up the rear at +18.5%, which still beats 92% of its thirteen-plus years
Average all twenty-two equally and you get +38.4%, the single best week out of the two-and-a-quarter years they all share. 😲
SPONSORED
Farmers Need Better Tools. Greenfield Is Building Them.

For generations, farmers have relied on bigger equipment and chemical inputs to improve productivity.
Greenfield Robotics is building a new category of agricultural equipment: autonomous robots designed to help farmers manage weeds with precision.
But the bigger opportunity may be the platform itself. It raises a bigger question: if robots can autonomously manage weeds, what other farm tasks could they eventually take on?
Greenfield is already expanding the platform beyond weeding, with feeding, spraying, and cover-crop planting on the roadmap.
The vision: a new generation of farm equipment that can perform more work autonomously—potentially reducing dependence on chemical inputs and the rising costs associated with conventional farming.
Investors can own a stake in Greenfield Robotics through its Regulation A+ offering. Currently in Testing the Waters. Join the waitlist.
Greenfield Robotics is Testing The Waters under tier 2 of Regulation A. No money or other consideration is being solicited, and if sent in response will not be accepted. No offer to buy the securities can be accepted and no part of the purchase price can be received until the offering statement filed by the company with the SEC has been qualified by the SEC. Any such offer may be withdrawn or revoked, without obligation or commitment of any kind, at any time before notice of acceptance given after the date of qualification. An indication of interest involves no obligation or commitment of any kind. “Reserving” shares is simply an indication of interest. There is no binding commitment for investors that reserve shares in this manner to ultimately invest and purchase the shares reserved of the company, or to purchase any shares of the company whatsoever.
TECHNICAL ANALYSIS
The Week Before Was Equally Nutty 🥜
If you want to talk about some extremes from one week to the next, look at the week of August 10 - that was a volatility crunch, a record one for some. 🗜
The altcoin index travelled 4.1% from its low to its high that week. In twelve and a half years of history it has never been smaller. Not once, going back to March 2014. It also bottomed within three basis points of the prior week's low, one of only five times in 645 weeks that two consecutive weekly lows have landed that close together.
$SOL ( ▼ 5.13% ) tightest week of its entire six-and-a-half-year life
SUI: tightest of its entire three-and-a-third-year life
$ETH ( ▼ 3.86% ) tightest in three years
$XLM ( ▼ 3.84% ) tightest in 22 months
BTC and ZEC: tightest in 11 months

Click to enlarge.
$XRP ( ▼ 2.45% ) travelled 13.1x further than it had the week before. SUI 10.2x, ENA 9.7x, SOL 9.5x. Rank those against each coin's own history and you get the biggest jump of SOL's six and a half years, the second biggest of AAVE's nearly nine, the second of ZEC's ten, the third of ETH's ten, and the second of the altcoin index's twelve and a half.
Only $LINK ( ▼ 4.73% ) and $UNI ( ▼ 6.39% ) stayed in shush mode, at 1.8x and 1.6x. Both had an up week during the week of August 10 - LINK up 15%, UNI down 18% - so neither had anything left to compress.
The candlesticks themselves are also weird. Stretch all twenty-two to the same height and the bodies vary quite a bit; 93% of the week's range at one end, 55% at the other - but they all begin in the same place. At the bottom. ⤵

Click to enlarge.
Five of them are or nearly are what’s known as a Marubozu candlestick pattern (long body with little to no wick/shadow), where the Monday-to-Friday move covered almost the entire week's range:
AAVE: 93% of the range was open-to-close. 6% above, less than 1% below.
ZEC: 92%
$MON ( ▼ 5.33% ): 91%
BTC: 89%, with under 1% of the range sitting beneath the open
ETH: 87%
Fourteen of the twenty-two had less than 3% of the week's range sitting below their opening price. Fifteen never traded more than 1.5% under the open. The deepest dip anyone took was $CRV ( ▼ 12.51% ) at -5.4%, and SOL did not dip at all - its low for the week was its opening price, to the cent. That has happened once in SOL's six and a half years.
There were no gaps either, just a continuous, bullish climb. 🐂
TECHNICAL ANALYSIS
Nobody Was Picking Winners 🤷
So everything went up at once and out of the tightest price action congestion on record. The next question is: where did the money go? Because a 78-point gap between the best coin and the worst one is not nothing. Sort the pool into buckets and a story jumps out immediately. 👇
DeFi +57.9% - ENA, AAVE, UNI, CRV
Memes +46.3% - PEPE, DOGE
Payments and store-of-value +39.9% - ZEC, XRP, XLM, BTC, LTC
Infrastructure +30.1% - FET, LINK
Smart-contract L1s +29.1% - MONAD, ETH, ADA, SOL, SUI, HBAR, DOT, AVAX
DeFi beat the L1 basket by 28.8 points in five days, and that is the widest gap between those two groups in the whole shared record. There’s some caveats there though; take ENA out and DeFi averages 45%, not 58%. Take MONAD out and the L1s average 26%.
Also, if money was rotating somewhere on purpose, something about a ticker should give a rough estimate of how much it moved/could move. We can gauge that a little by finding data like:
How far below its all-time high it was trading
How it had done over the prior eight weeks
Over the prior six months:
How old the coin is
How much that crypto normally moves in a week

Click to enlarge.
The single best explanation of how much any ticker gained last week is how much that coin moves in a normal week. Bitcoin, the least volatile name in the pool, gained the sixth-least. Zcash, which swings three times as hard as anything else (past 24 months), gained the second-most. Everything in between landed roughly where its own range said it should.
That is what a market-wide repricing looks like. It is what you get when something bids the whole index at once and every crypto moves in proportion to how twitchy it already was. 🧠
TECHNICAL ANALYSIS
A Bit Off The Top, Please ✂
Twenty-one of the twenty-two have a bigger tail/wick/shadow on top than below - a median 24% of the week's range sitting above the close, against 2% below. MONAD is the only exception, and only barely. ADA gave back 36% of its range before the close, AVAX 34%, DOT 34%, SUI 33%, XLM 33%, LINK 32%. 🔢
Nobody was selling into the lows but plenty of people were selling into the highs.
Priced in Bitcoin rather than dollars, five names finished the week down: LTC -4.2%, AVAX -2.7%, DOT -1.0%, LINK -0.7%, HBAR -0.2%. If you run a relative-value book, the best week this pool has ever shared was a losing week in five of your twenty positions.
Four tickers made a fresh low on Monday and closed above the prior week's high on Friday - DOT, FET, HBAR and SUI. Eight names printed that full reversal shape in total. Worth naming precisely: FET's was its lowest price in three and a half years, SUI's in two, HBAR's in twenty-one months, and DOT's was the lowest price in its entire history.
Zoom out to the year and the whole thing gets smaller. The average coin gained 39% last week and the pool is still down about a quarter on 2026. ⬇

Click to enlarge.
Two names out of twenty-two are green on the year: ZEC at +70.2% and MONAD at +5.7%. BTC is -15.0%, ETH -21.6%, the index -19.9%. The floor is DOT at -56.7%, SUI -49.8%, AVAX -46.6%, ADA -43.4%.
The altcoin index added $102.9 billion last week. That is the tenth-largest one-week dollar gain in its history, off a top-5% percentage week, because the base it is compounding from is a third smaller than it was in 2021. The single week of May 2021 destroyed $349 billion, more than three times what last week created.
ZEC remains the exception to everything. Highest weekly close it has ever printed, +2,410% off its August 2025 low, up nineteen-fold over 52 weeks. Its high last week cleared 448 consecutive prior weekly highs before running into one it could not take: 900.00, set the week of January 8, 2018. It stopped 1.54% short.
BTC's raw all-time rank of 43rd badly understates it, because the list runs back nearly seventeen years and includes weeks from 2010 like +1,126%. Cut it to 2018 forward and it is the 6th-best week of the last eight and a half years. Since 2021, the 3rd-best of five and a half years.
Still, for crypto centric people, last week was good and it felt good. Something the space needed. Let’s see if it lasts. 👍
Get In Touch 📬
Email me, Jonathan Morgan, feedback; I’d love to hear from you. 📧
Follow me on Stocktwits 🫂 And Sponsor this newsletter 😎
|
Get the app Real-time alerts, live earnings calls, your personalised feed - the best experience is on mobile.
|


Terms & Conditions 📝
Securities Disclaimer: STOCKTWITS IS NOT A TAX ADVISOR, BROKER, FINANCIAL ADVISOR OR INVESTMENT ADVISOR. THE SERVICE IS NOT INTENDED TO PROVIDE TAX, LEGAL, FINANCIAL OR INVESTMENT ADVICE, AND NOTHING ON THE SERVICE SHOULD BE CONSTRUED AS AN OFFER TO SELL, A SOLICITATION OF AN OFFER TO BUY, OR A RECOMMENDATION FOR ANY SECURITY. Trading in such securities can result in immediate and substantial losses of the capital invested. You should only invest risk capital, and not capital required for other purposes. You alone are solely responsible for determining whether any investment, security or strategy, or any other product or service, is appropriate or suitable for you based on your investment objectives and personal and financial situation. You should also consult an attorney or tax professional regarding your specific legal or tax situation. The Content is to be used for informational and entertainment purposes only and the Service does not provide investment advice for any individual. Stocktwits, its affiliates and partners specifically disclaim any and all liability or loss arising out of any action taken in reliance on Content, including but not limited to market value or other loss on the sale or purchase of any company, property, product, service, security, instrument, or any other matter. You understand that an investment in any security is subject to a number of risks, and that discussions of any security published on the Service will not contain a list or description of relevant risk factors. In addition, please note that some of the stocks about which Content is published on the Service have a low market capitalization and/or insufficient public float. Such stocks are subject to more risk than stocks of larger companies, including greater volatility, lower liquidity and less publicly available information. Read the full terms & conditions here. 🔍
Author Disclosure: The author of this newsletter holds positions in AVAX, ADA, PUDGY, WLD, NEAR, INJ, LTC, LINK, ZEC, XLM, and FET. 📋