OVERVIEW
Everything You Need To Know About Q4 🧠
Here’s What’s Happening 👇
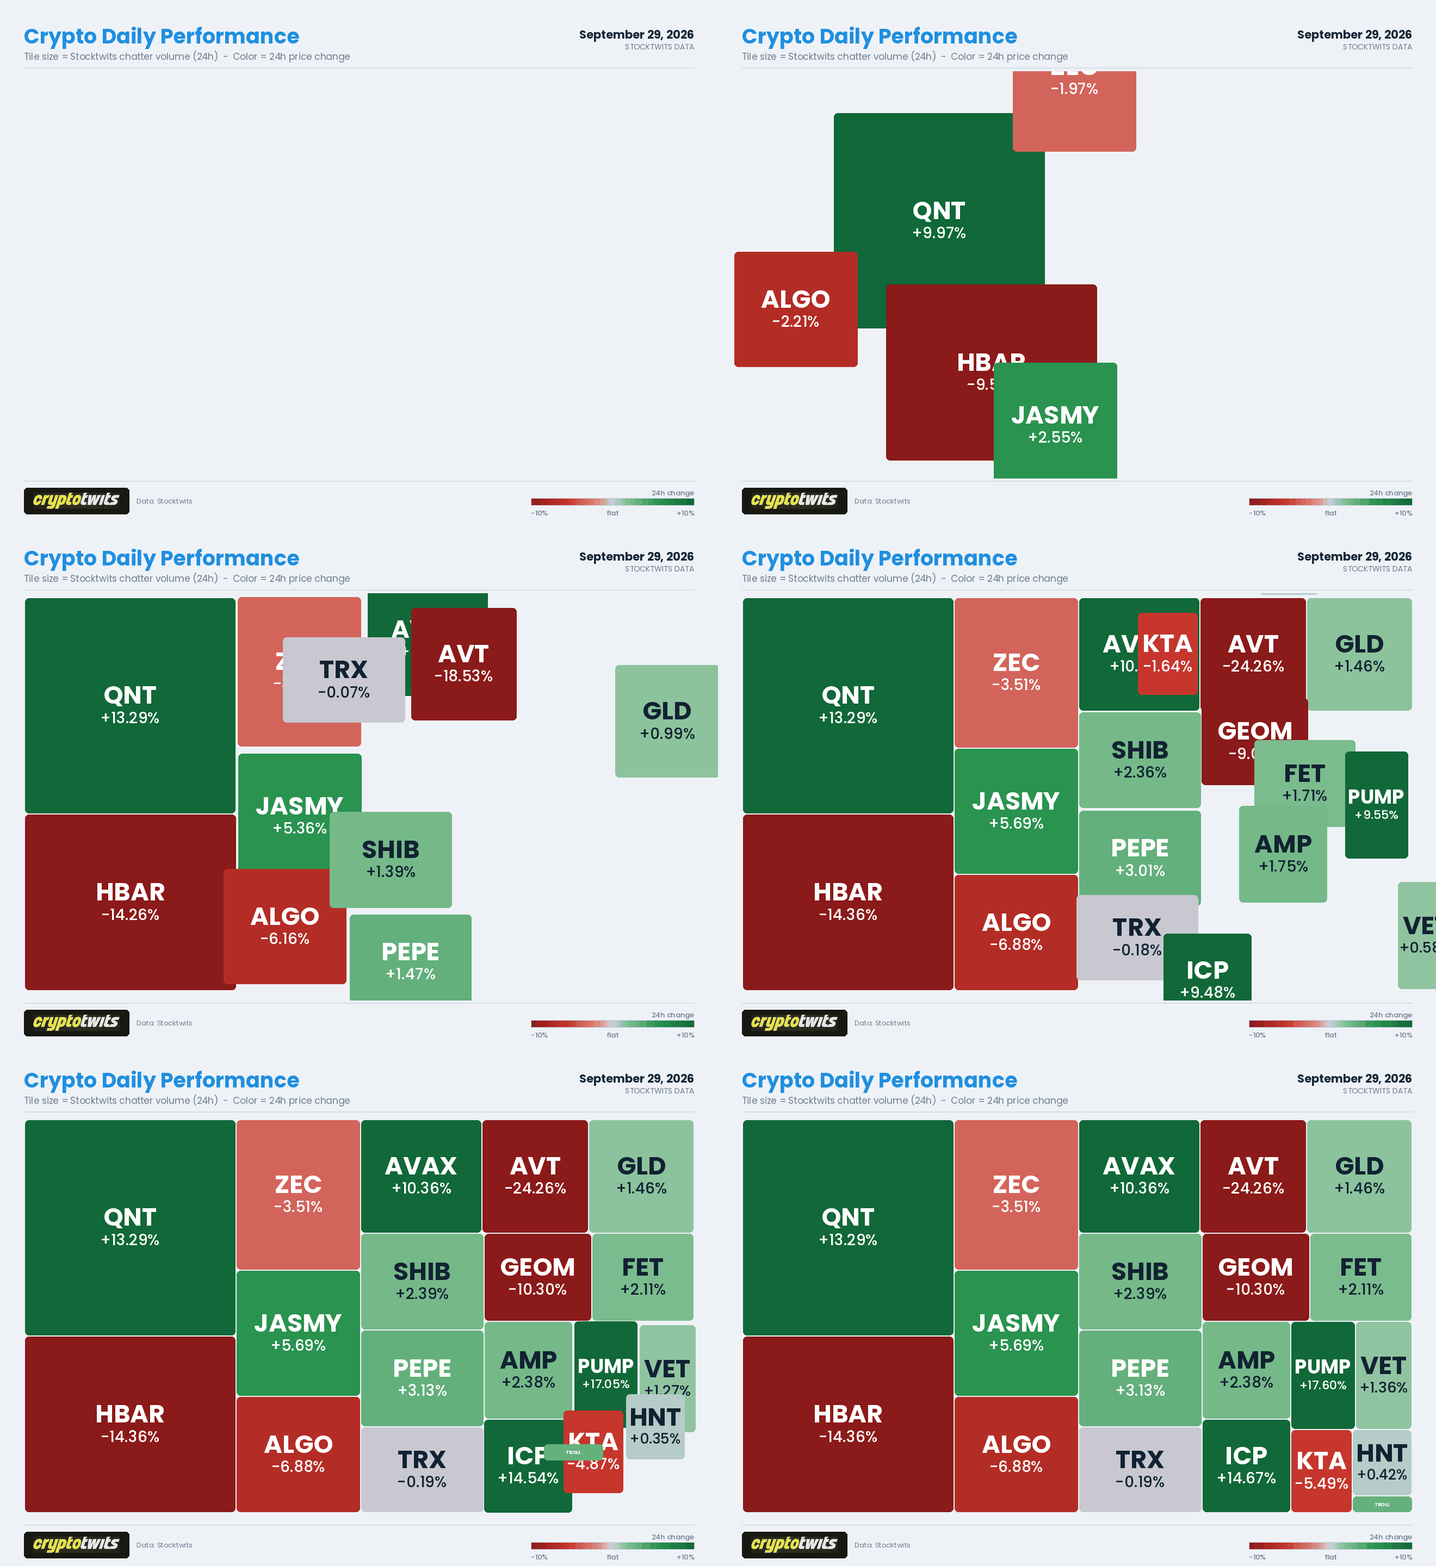
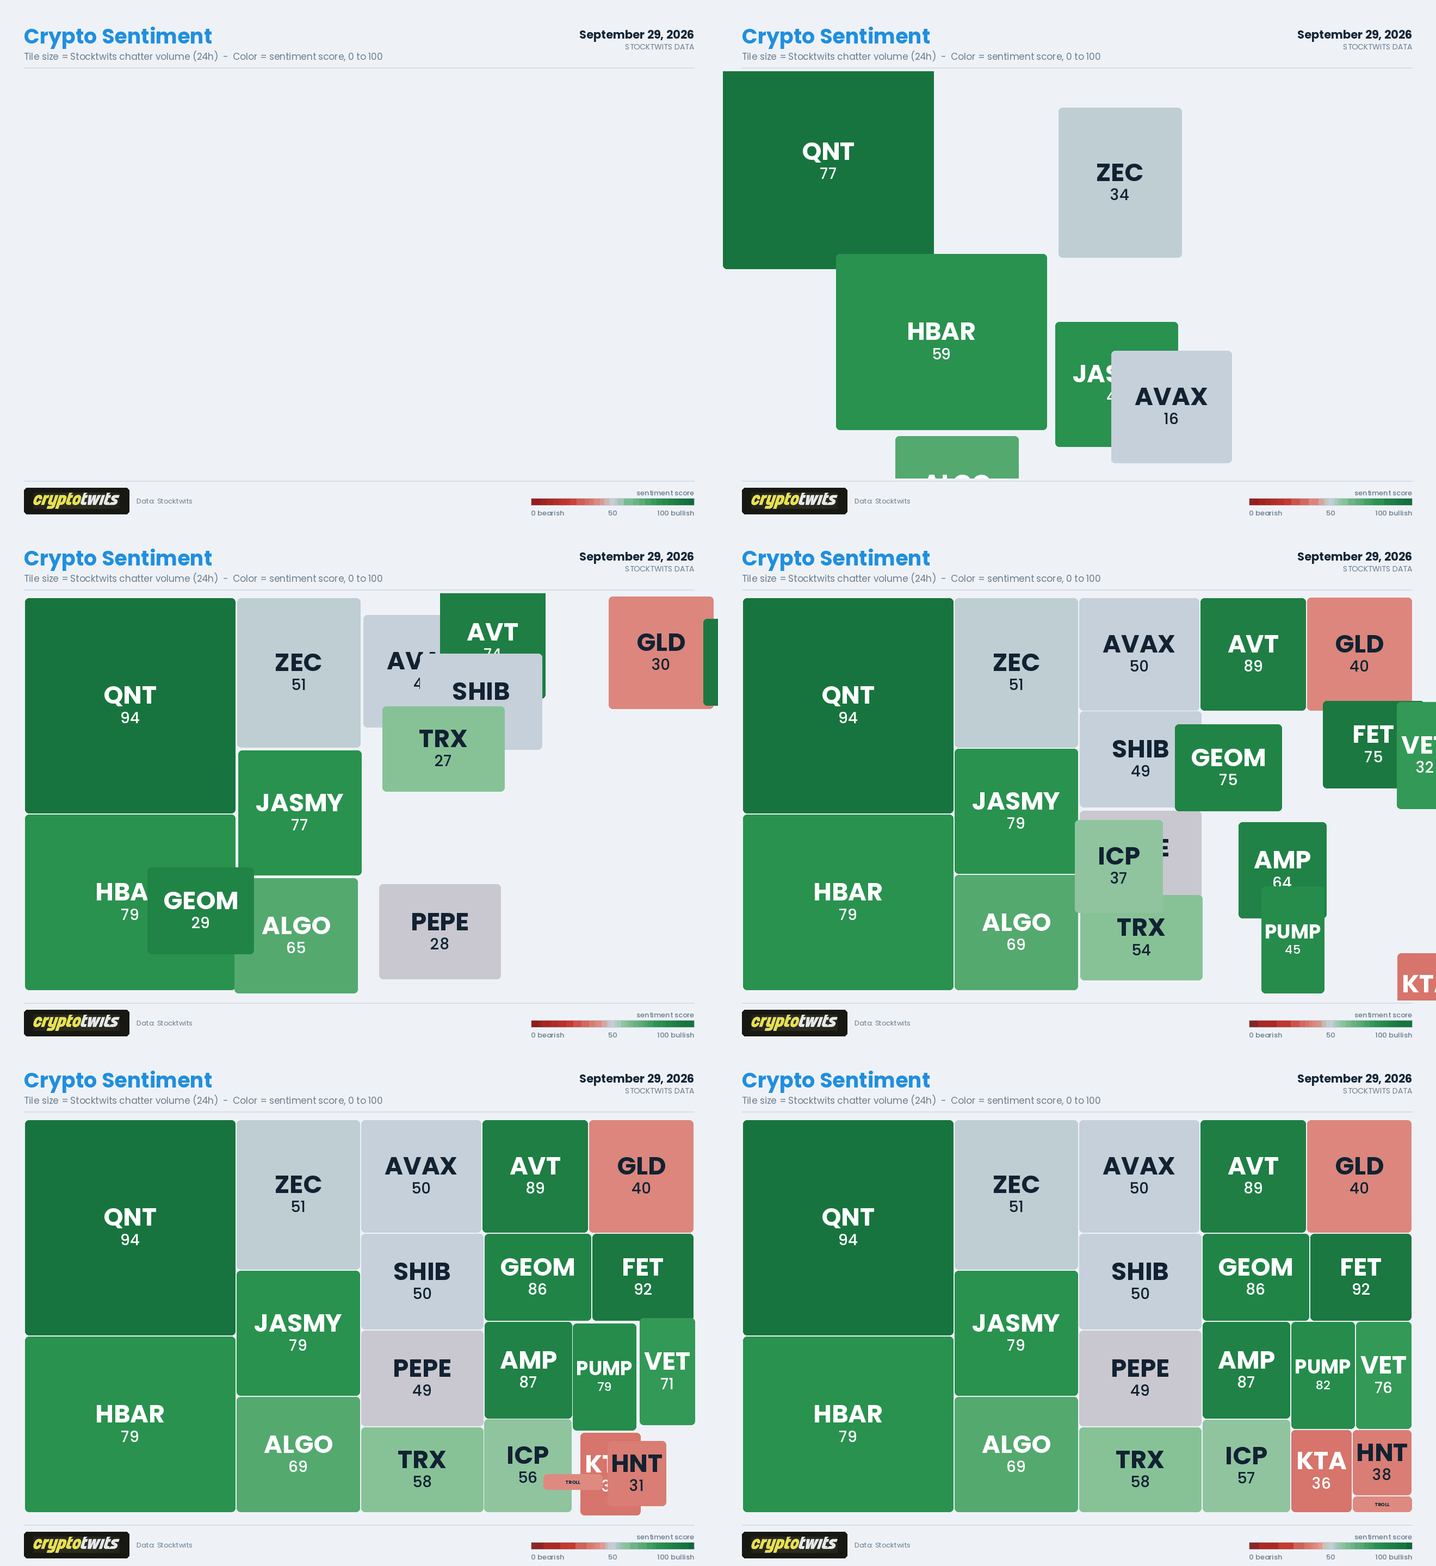
Q4 2026
The Fork 🔀
The total crypto market cap (called TOTAL here) opened the fourth quarter this morning at $2.84 trillion. Up 41% on the quarter we just closed. Down 34% from last October’s top. And parked about 5% under the one line on the monthly chart that has decided every bear-market fourth quarter since 2018. 👀
So, which is it? Is this the best quarter of the year, the one everybody’s been saving their “Uptober” posts for? Or is it the quarter where this market has a habit of either topping out or falling through the floor?
Yes.
Morpheus is holding out two pills. One says June was the low and the ETF era just broke a 12-year pattern. The other says the cycle is right on schedule and the trapdoor opens between October 15 and Thanksgiving.
Now, I’m not going to tell you which pill to take. I’m going to tell you exactly where the two hallways split, so you know which one you’re in before Agent Smith does. 💊
Q4 2026
The Record 📜
Twelve completed fourth quarters on TOTAL, 2014 through 2025. Seven green, five red. The average is +48%, which sounds great until you notice 2017 is doing all the lifting. Take 2017 out and the average is +25%, the median +11%. Still the best quarter on average and median. Not on hit rate, though. Q2 is 8 for 12. Q4 is 7 for 12. #⃣

Click to enlarge.
The five red years are all between -14% and -43%. Six of the seven green years are +46% or better. There is exactly one result in the middle, 2021’s +11%, and that one was a cycle top that happened to close the quarter above where it opened.
How binary is it, really? Twelve data points binary, so don’t build a religion on it. But in twelve tries, and with the exception of 2021, Q4 has not once done “meh.” It picks a hallway and runs. 🏃
Q4 2026
Two Rules You Can Set A Watch By ⏱
Ten years of daily data cough up two things that have held every time. ✌
Rule one: the floor. Every green fourth quarter stayed within 7.5% of its October 1 open at the worst point of the whole quarter. Every red fourth quarter traded at least 19% below its open.
In every green year, the low of the entire quarter printed by October 12 and was never seen again. In every red year, the October low was the first low, and the real bottom showed up between November 21 and December 18. So the dip small enough to miss has been the one worth buying, and the dip big enough to screenshot has been the opening act.
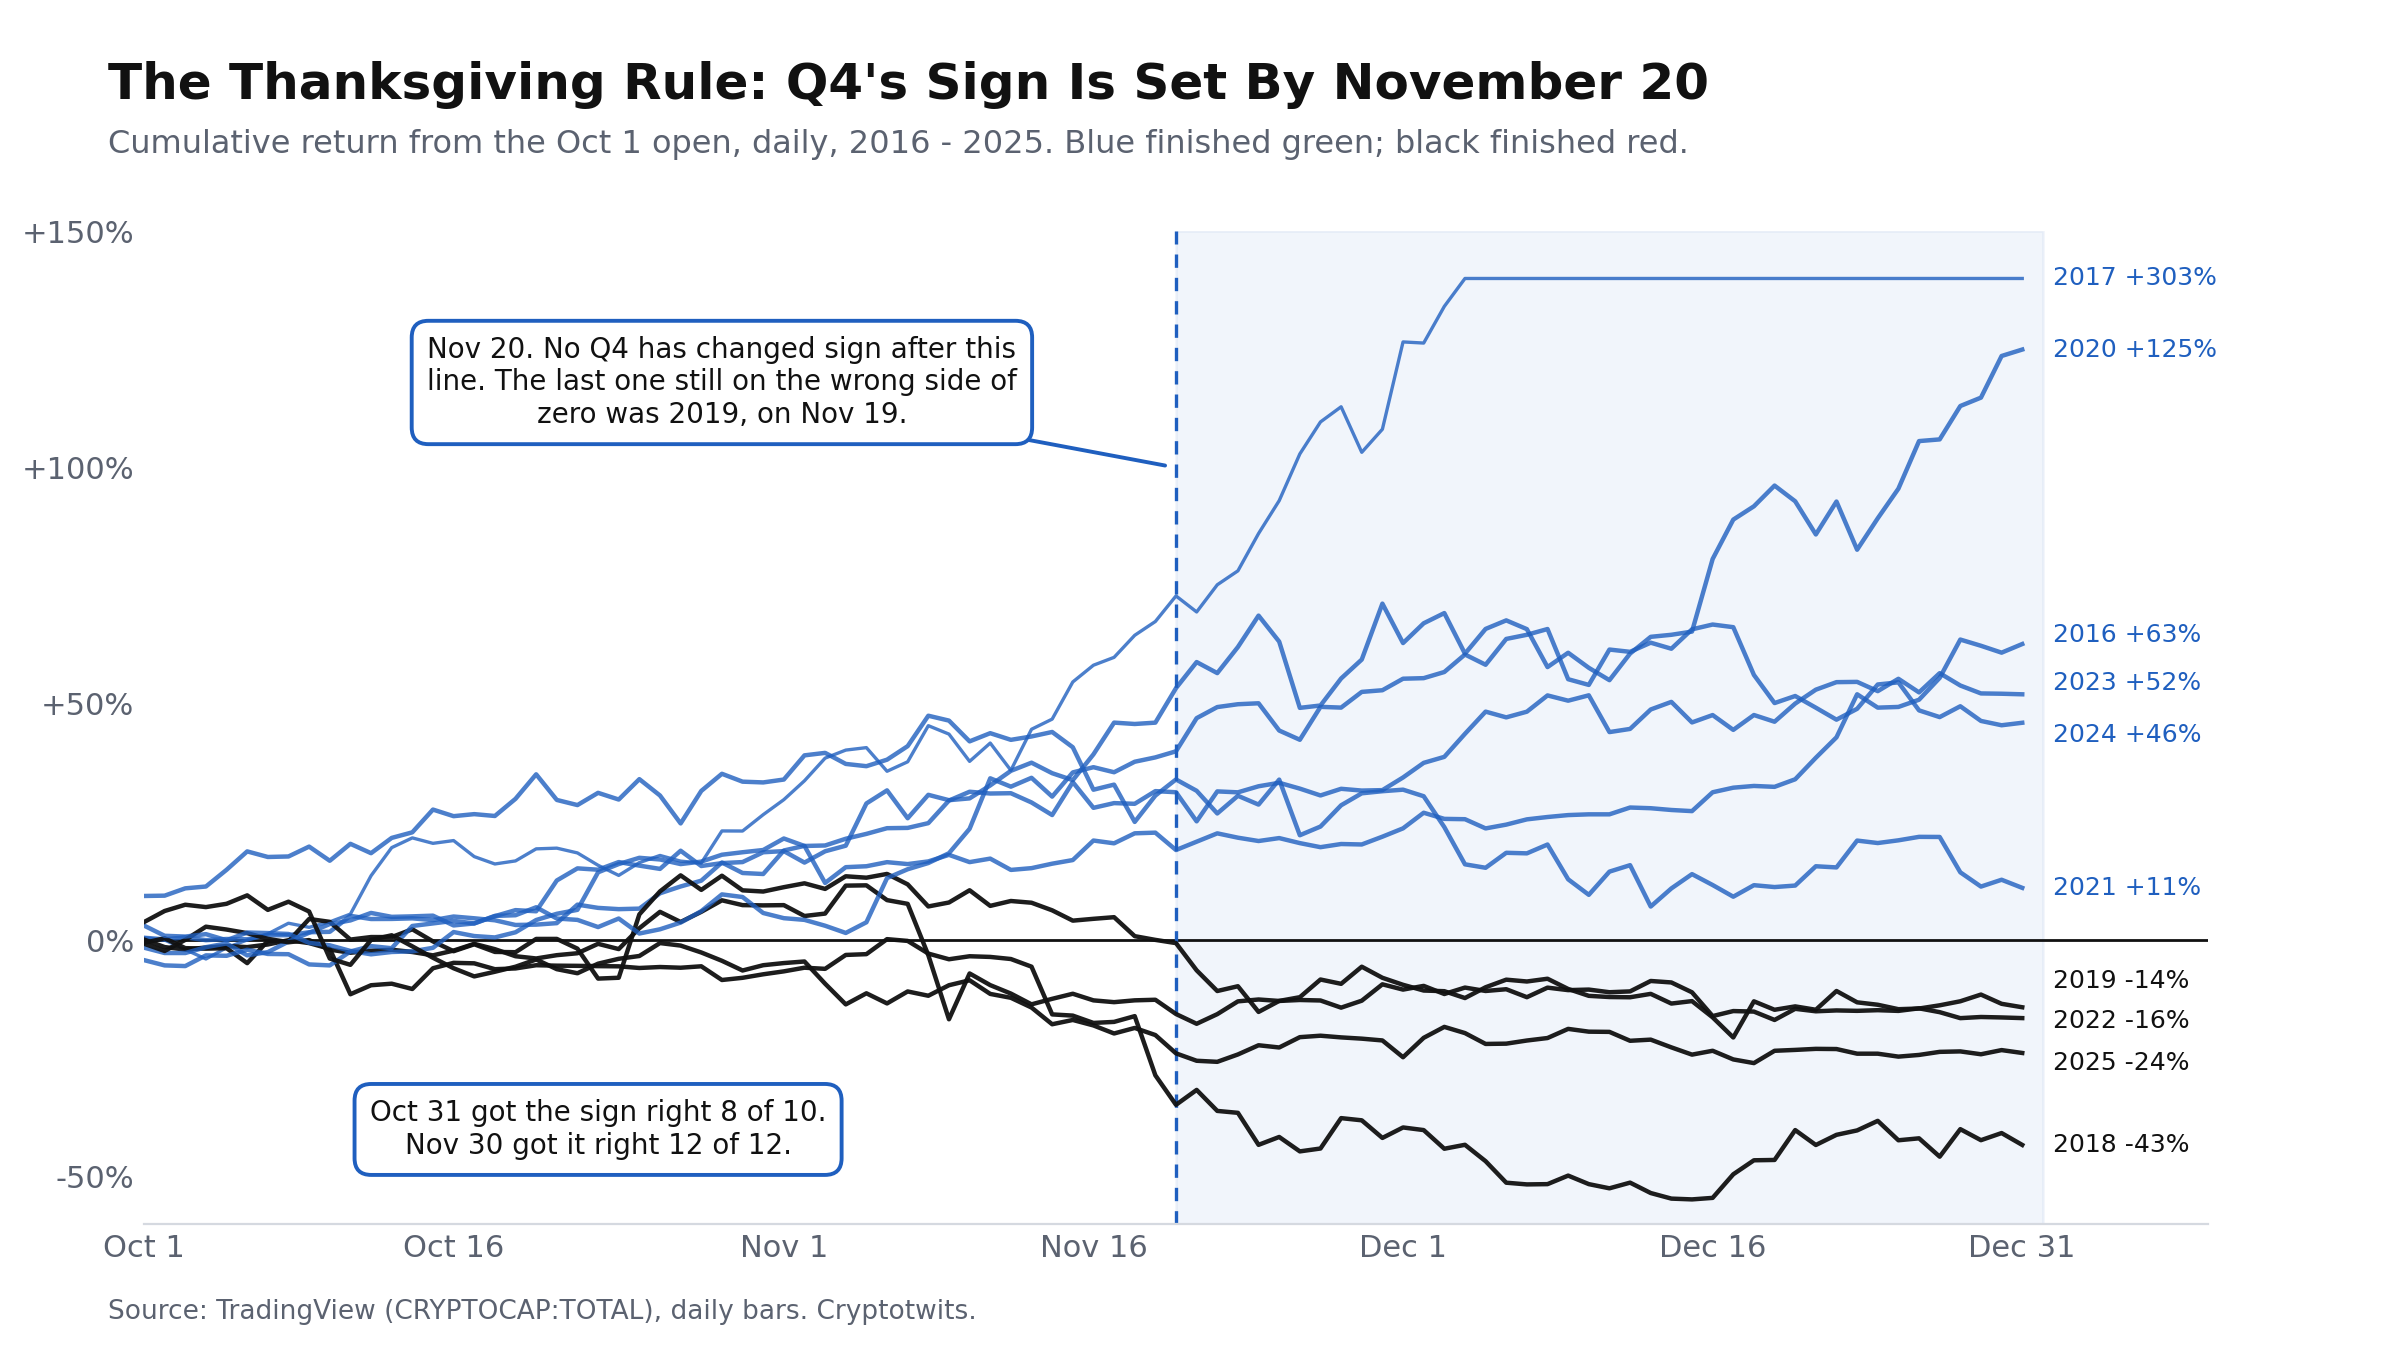
Rule two: the calendar. Take the quarter’s cumulative return on any given date and check whether its sign matches the sign on December 31. On October 31 they matched eight years in ten. From November 20 onward? Ten for ten. No fourth quarter in the daily record has crossed zero after November 19.
Click to enlarge.
The monthly data agrees: twelve for twelve through November 30. December has never flipped a fourth quarter. The direction is set by the time your relatives are arguing over Thanksgiving.🦃
Q4 2026
Where 2026 Sits 📍
Count from the April 2024 halving and this is year two. That drops 2026 into the same bucket as 2014, 2018, and 2022. How’d that bucket do? Pretty damned bad. Fourth quarters of -16%, -43%, and -16%, and in every one of them the cycle low printed inside the quarter or the month after. 😬
The last two cycle lows were 47 months apart and the prior tops were followed by their lows about a year later. All of this has happened before, and all of this will happen again. Maybe.
Then you look at price, and every price measure says 2026 does not belong in that bucket. The prior year-two Septembers closed 66% to 72% below the all-time high. This one closed 34% below. The prior three cycles bottomed at -76%, -88%, and -76%. This one, so far, at -53%. And the third quarter we just closed was +41%, the only one on record where July, August, and September all closed green.
I went looking for an analog. Every month-end back to 2011, filtered for this setup. How many matches out of 332 months? Zero. None. It’s the Kobayashi Maru: there’s no winning answer in the simulator.
Click to enlarge.
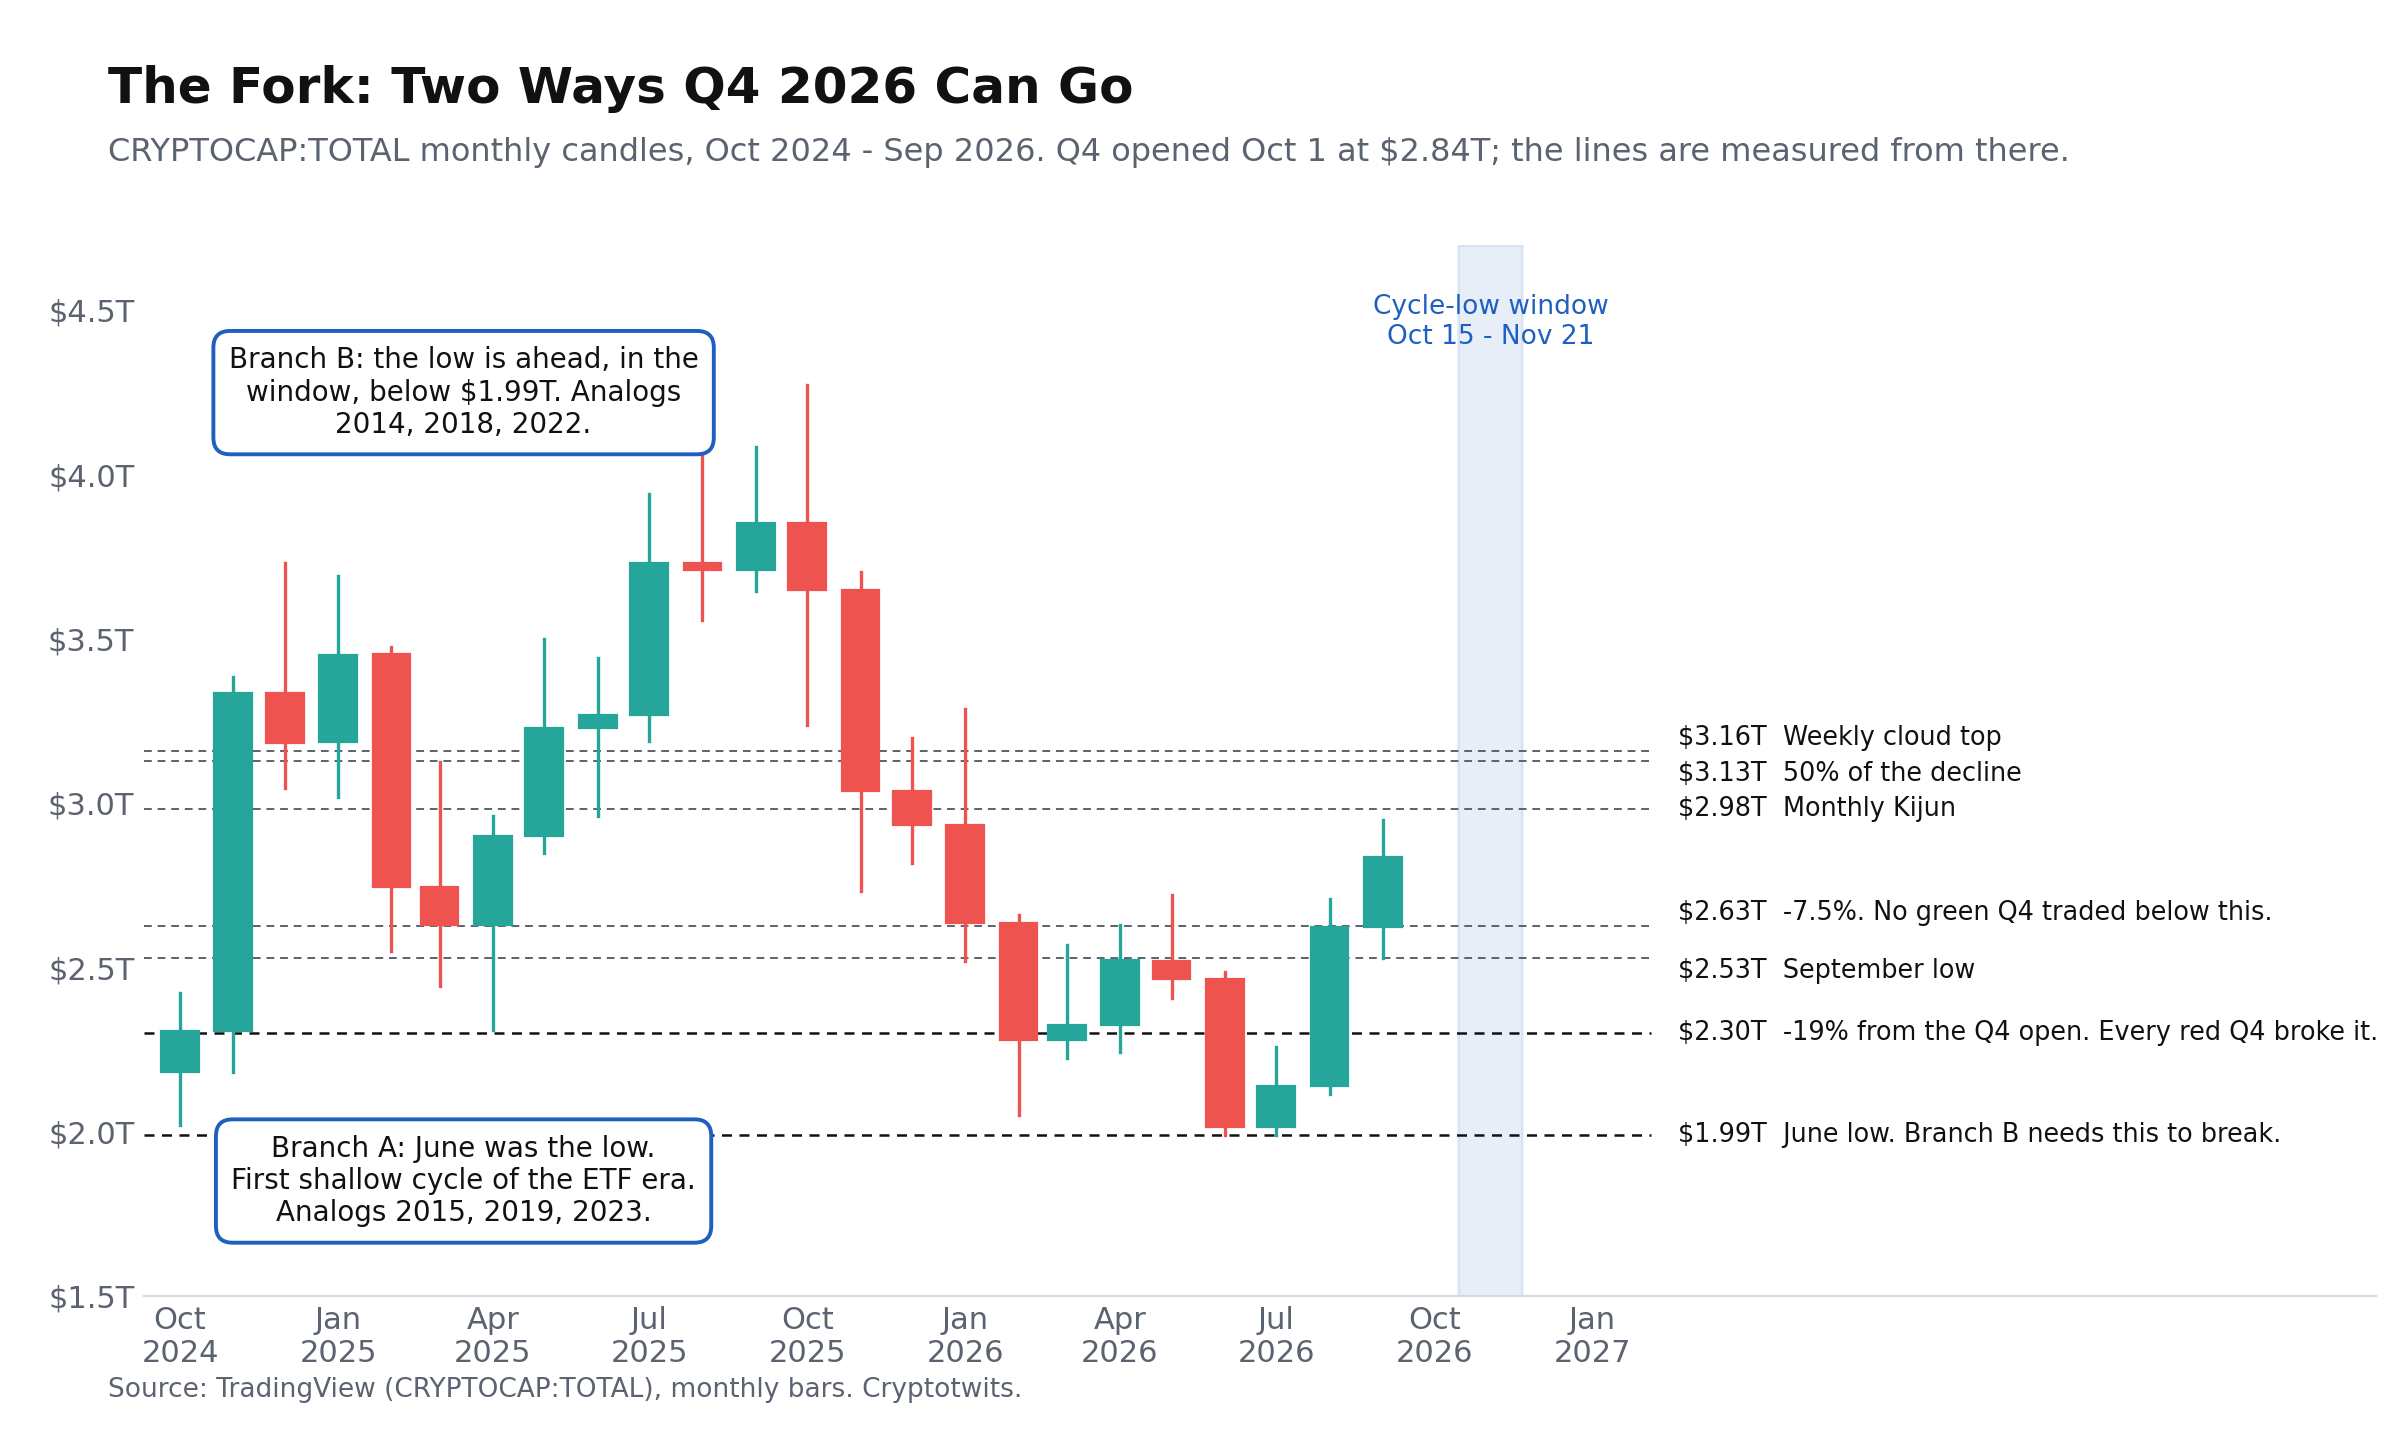
Branch A: June was the low. The ETF era produced the first cycle that bottomed at -53% instead of -80%, and this is a recovery-year fourth quarter. The analogs are 2015 (+86%), 2019 (-14%), and 2023 (+52%).
Branch B: the low is ahead. The cycle is intact, June was a rest stop, and the real low prints inside the window, below $1.99 trillion. The analogs are 2014, 2018, and 2022, and in each one the thing that broke had a name. A flash crash and a US Marshals auction. A hash war and a Fed hike. He Who Must Not Be Named, with the Bahamas penthouse.
Which one is it? I don’t know. Nobody does. 🤷
Q4 2026
The Calendar 📅
Click to enlarge.
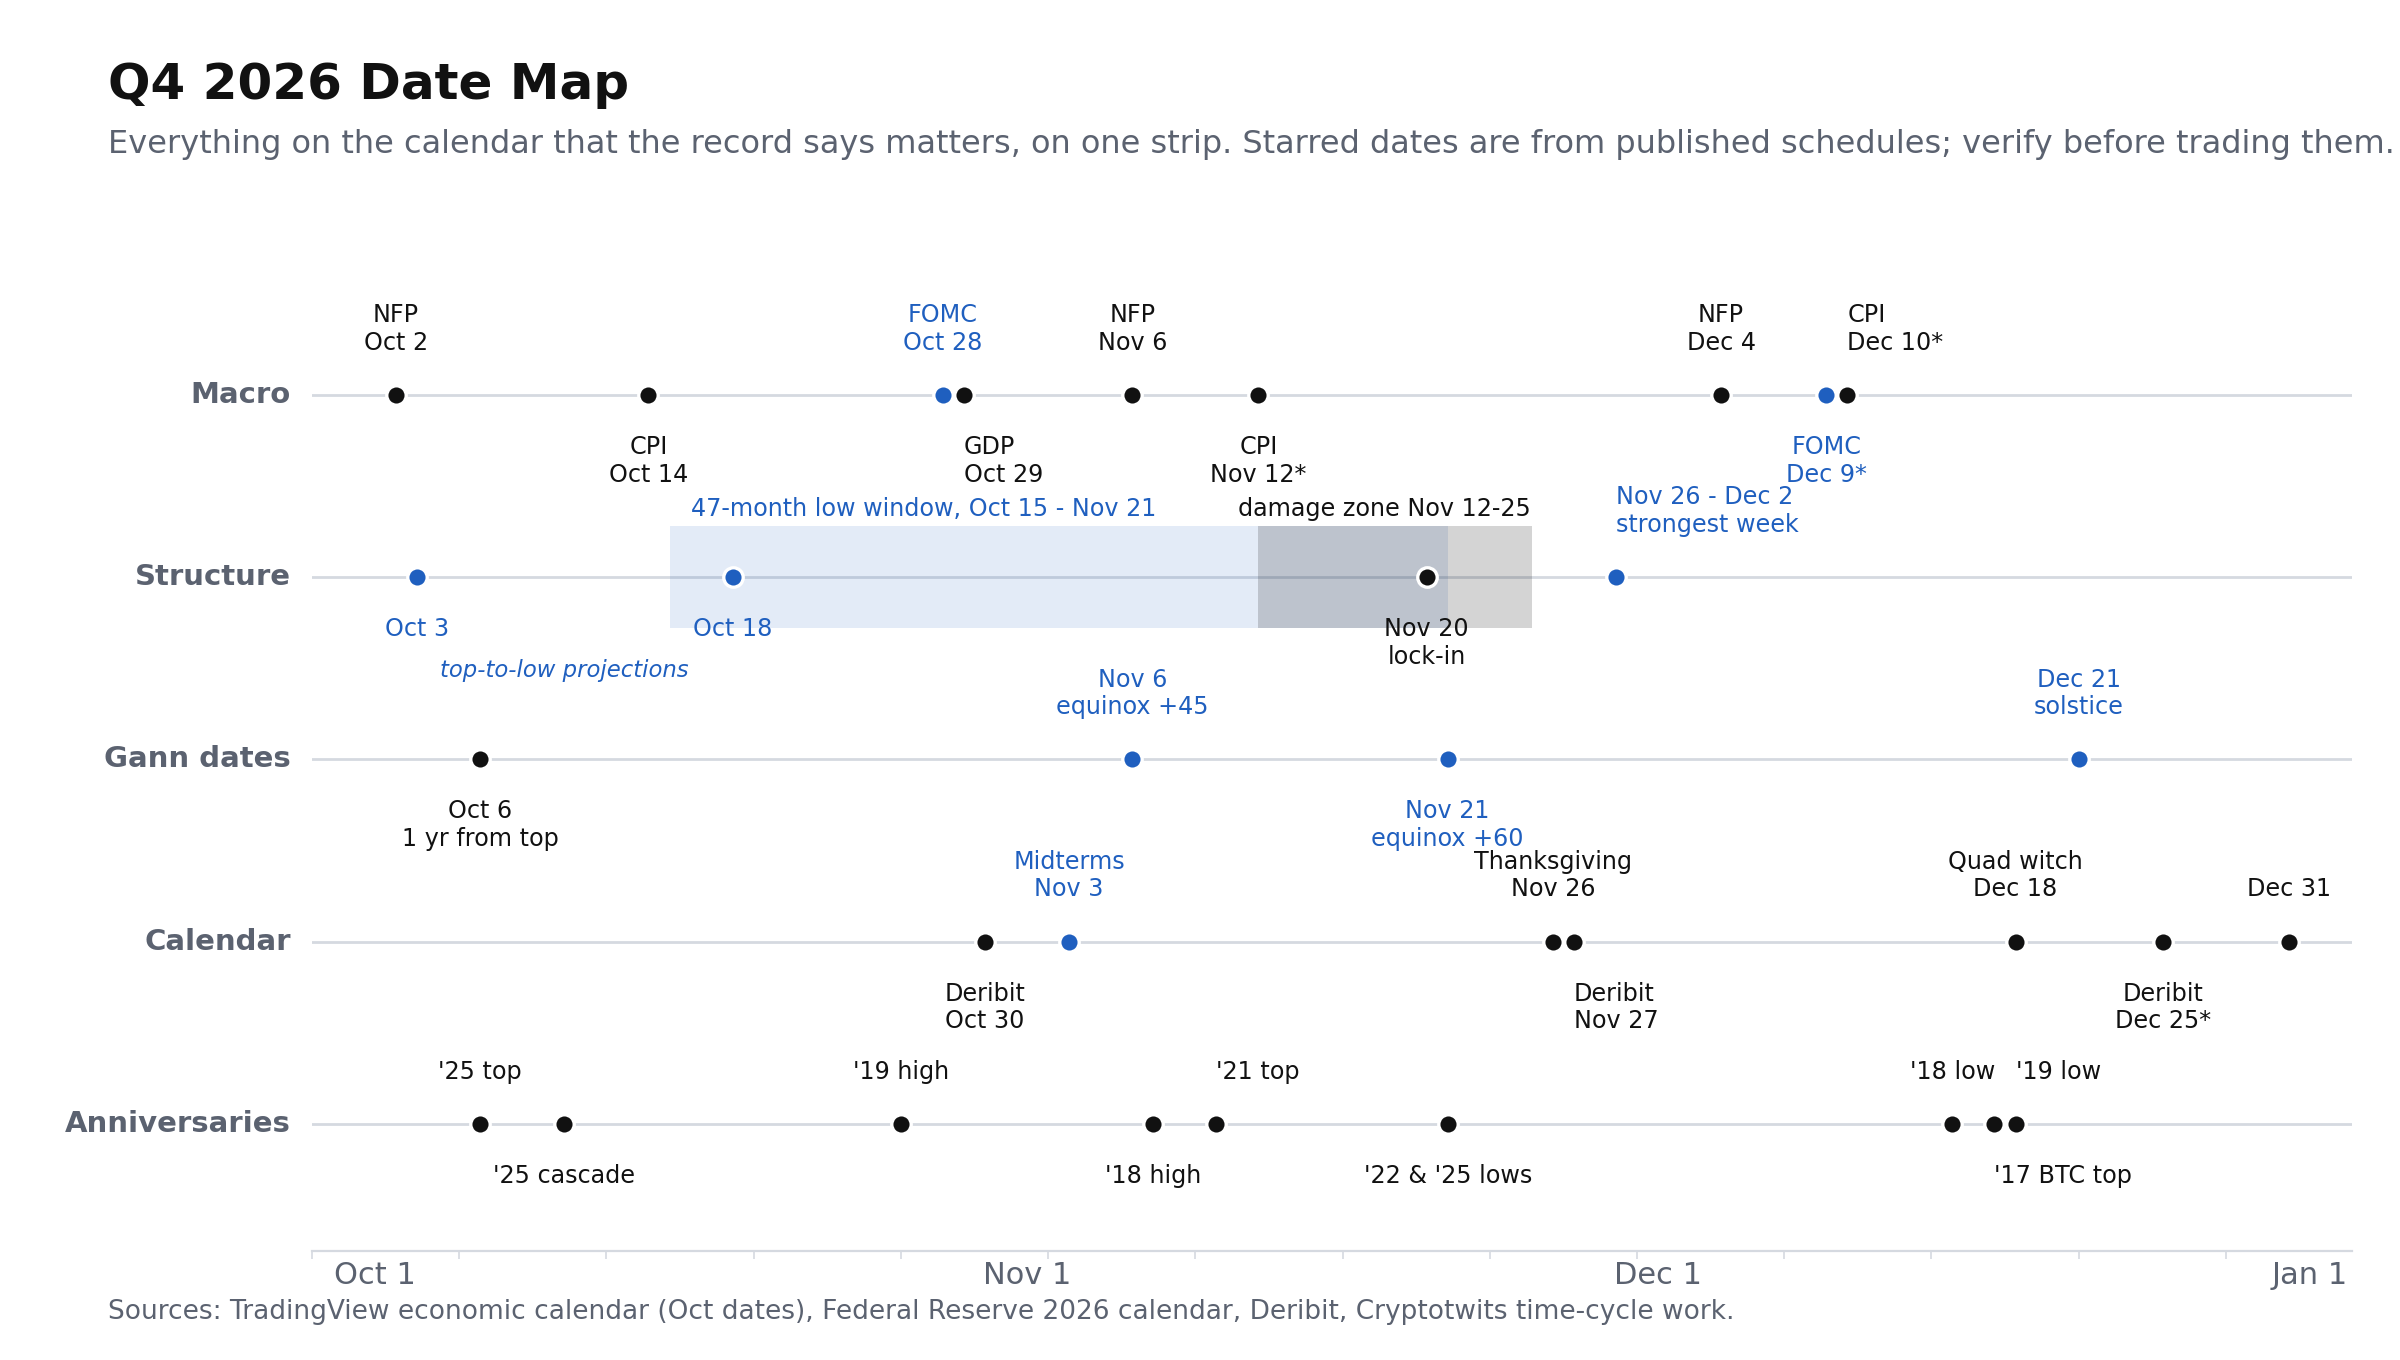
Oh boy, this is my favorite part. Time cycles. But what is this thing? Every date between now and New Year’s that has mattered in a past fourth quarter, on one strip. Five rows, top to bottom. ⏳
Macro: the scheduled economic data. Jobs tomorrow, CPI on the 14th, FOMC on the 28th, GDP on the 29th, FOMC again December 9.
Structure: the windows this piece has been building toward. More on those in a second.
Gann dates: fixed dates counted off the September 22 equinox. November 6, November 21, December 21.
Calendar: midterms November 3, Thanksgiving, the monthly options expiries, quad witching December 18.
Anniversaries: the dates past tops and lows printed. October 6 is one year to the day from the top, if you light candles for that sort of thing.
What date ranges are most important? These three:
October 15 to November 21, the low window. If the 47-month cycle is still running, this is where the low prints.
November 12 to 25, the damage zone. Most weeks in the quarter close green six or seven years in ten. These two manage four and five, went zero for four in the red years.
November 26 to December 2, the best week. Green nine years in ten, including all four red years. The forced sellers are usually out of ammo by then.
And the Gann dates? Decoration? Check the record. The 2022 and 2025 fourth-quarter lows both printed on November 21. The 2018 and 2022 highs landed within a day of November 6, and the 2021 cycle top came four days after it. Five of the six green-year highs in the daily record printed on December 17 or later, right around the December 21 solstice. These dates are fixed points in time.
So how is any of this useful? It tells you when to pay attention. Every red fourth quarter did its real damage between November 8 and December 19. A selloff inside that stretch is the quarter doing what it has done before. A rally that survives it is the first thing the bears can’t explain. ⏰
Q4 2026
Watch Bitcoin First 🥇
One more thing: whatever the fourth quarter has done, Bitcoin has done it first. 🎬
In all five red fourth quarters, the alt basket (TOTAL minus Bitcoin) fell harder than Bitcoin did. Bitcoin beat the alts in six of the last seven fourth quarters, including 2020, when Bitcoin’s cap rose 170% and the alts managed 60%. The one honest-to-God alt fourth quarter was 2017.
And the 41% third quarter that got us here was Bitcoin’s. Also worth noting: Bitcoin’s Dominance opened the quarter at 59.3% and hasn’t moved two full points in a year. If Branch A is right, the rotation out of Bitcoin is where the second leg’s money is, and that has historically been November’s business. If Branch B is right, the alts are where the money leaves first.
Either way Bitcoin is the tell. 🪙
Q4 2026
Where Things Stand Today 📊
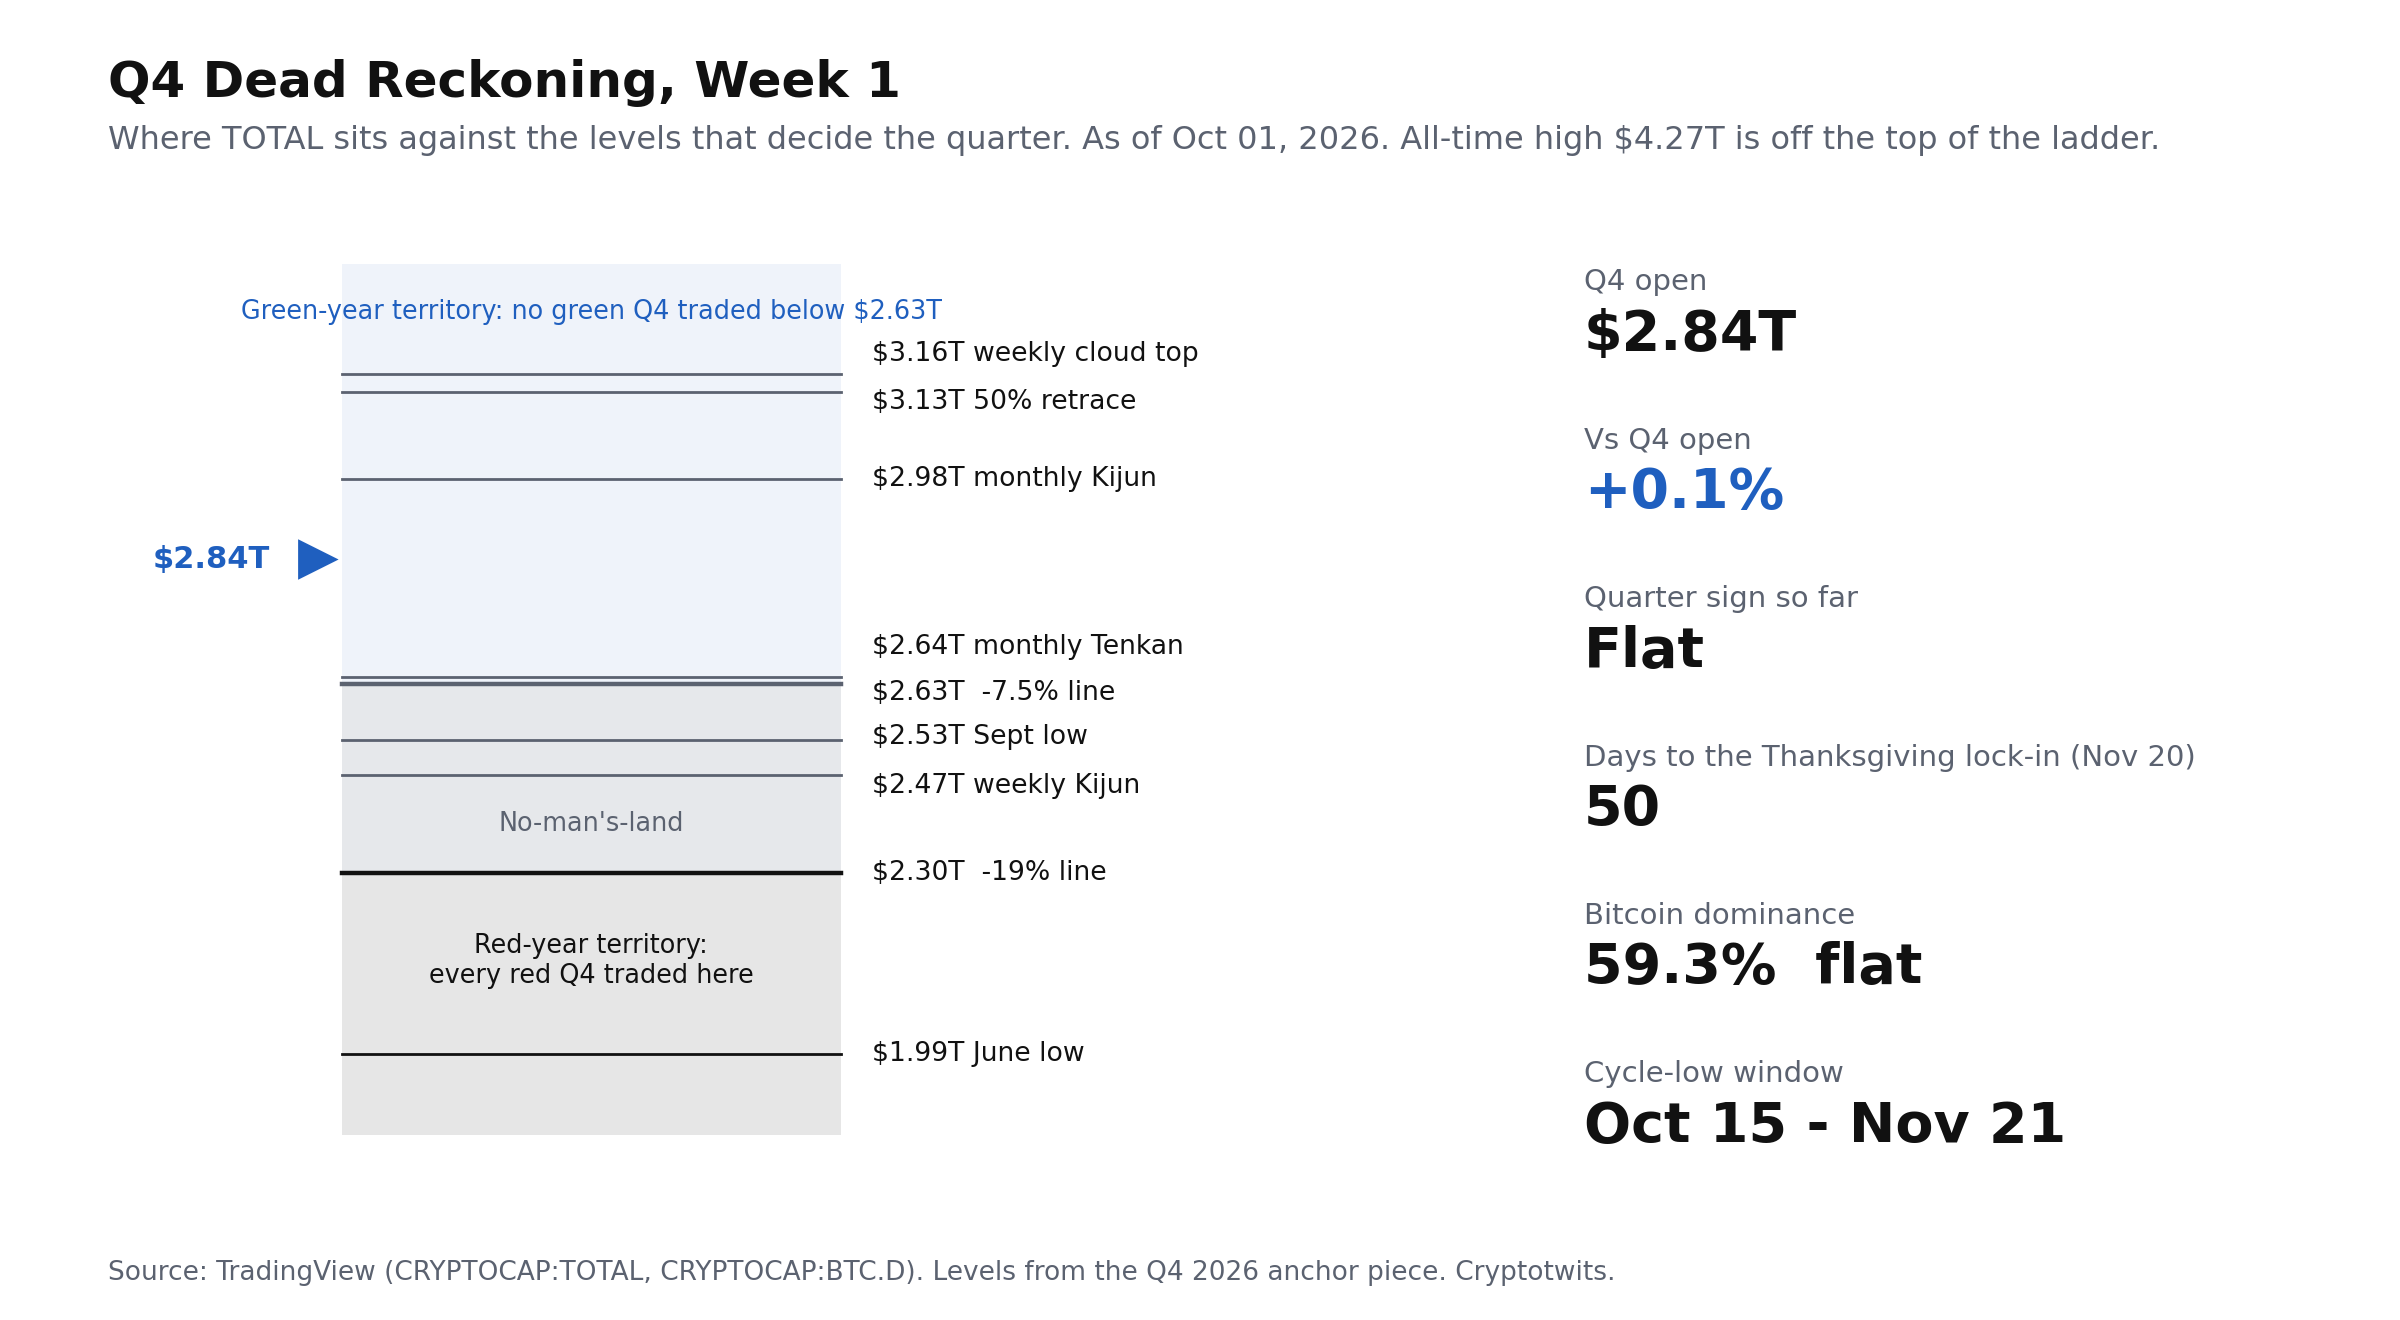
TOTAL opened the quarter at $2.84 trillion and is trading there now. Flat, by definition. Fifty days to the November 20 lock-in. 🔒
Territory: green-year, by 7.5%. The floor of that zone is $2.63 trillion. Below it is the gap down to $2.30 trillion, which every red fourth quarter has broken. The September low at $2.53 trillion sits inside the gap.
Window: two weeks out. The 47-month count opens October 15. The first top-to-low projection lands Saturday, October 3.
Dominance: 59.3%, flat on the month and flat on the year. The third-quarter rally was Bitcoin-led.
The fork: undecided, and it should be. First evidence either way is whether $2.63 trillion holds through the window. Overhead, $2.98 trillion is the monthly Kijun, and the rally stopped one percent under it in September. 🛑
OLD NEWS
Other Stuff That Happened Today, But A Long Ass Time Ago ⌛
October 1
331 B.C. - Alexander the Great defeated a much larger Persian army at Gaugamela, shattering Darius III’s empire. Traditionally dated October 1
1553 - Mary I was crowned queen of England, becoming the country’s first woman crowned in her own right
1800 - Spain secretly returned Louisiana to France
1890 - Congress established Yosemite National Park
1903 - The first modern World Series began between the Pittsburgh Pirates and Boston Americans
1908 - Ford introduced the Model T at $825
1958 - NASA officially opened for business with roughly 8,000 employees, 3 laboratories and no Moon rocks
1960 - Nigeria gained independence from Britain
1971 - Walt Disney World opened in Florida. Adult ticket: $3.50. Parking: 50 cents
1975 - Muhammad Ali defeated Joe Frazier after 14 punishing rounds in the “Thrilla in Manila.”
1982 - Sony released the world’s first commercial compact-disc player in Japan. It cost roughly $730
1991 - Yugoslav forces began the Siege of Dubrovnik, shelling the historic Croatian city for months
Get In Touch 📬
Email me, Jonathan Morgan, feedback; I’d love to hear from you. 📧
Follow me on Stocktwits 🫂 And Sponsor this newsletter 😎
|
Get the app Real-time alerts, live earnings calls, your personalised feed - the best experience is on mobile.
|


Terms & Conditions 📝
Securities Disclaimer: STOCKTWITS IS NOT A TAX ADVISOR, BROKER, FINANCIAL ADVISOR OR INVESTMENT ADVISOR. THE SERVICE IS NOT INTENDED TO PROVIDE TAX, LEGAL, FINANCIAL OR INVESTMENT ADVICE, AND NOTHING ON THE SERVICE SHOULD BE CONSTRUED AS AN OFFER TO SELL, A SOLICITATION OF AN OFFER TO BUY, OR A RECOMMENDATION FOR ANY SECURITY. Trading in such securities can result in immediate and substantial losses of the capital invested. You should only invest risk capital, and not capital required for other purposes. You alone are solely responsible for determining whether any investment, security or strategy, or any other product or service, is appropriate or suitable for you based on your investment objectives and personal and financial situation. You should also consult an attorney or tax professional regarding your specific legal or tax situation. The Content is to be used for informational and entertainment purposes only and the Service does not provide investment advice for any individual. Stocktwits, its affiliates and partners specifically disclaim any and all liability or loss arising out of any action taken in reliance on Content, including but not limited to market value or other loss on the sale or purchase of any company, property, product, service, security, instrument, or any other matter. You understand that an investment in any security is subject to a number of risks, and that discussions of any security published on the Service will not contain a list or description of relevant risk factors. In addition, please note that some of the stocks about which Content is published on the Service have a low market capitalization and/or insufficient public float. Such stocks are subject to more risk than stocks of larger companies, including greater volatility, lower liquidity and less publicly available information. Read the full terms & conditions here. 🔍
Author Disclosure: The author of this newsletter holds positions in AVAX, ADA, PUDGY, WLD, NEAR, INJ, LTC, LINK, ZEC, XLM, and FET. 📋