In partnership with

OVERVIEW
Why Is Crypto's Airbag Full Of Murder Hornets? 💉
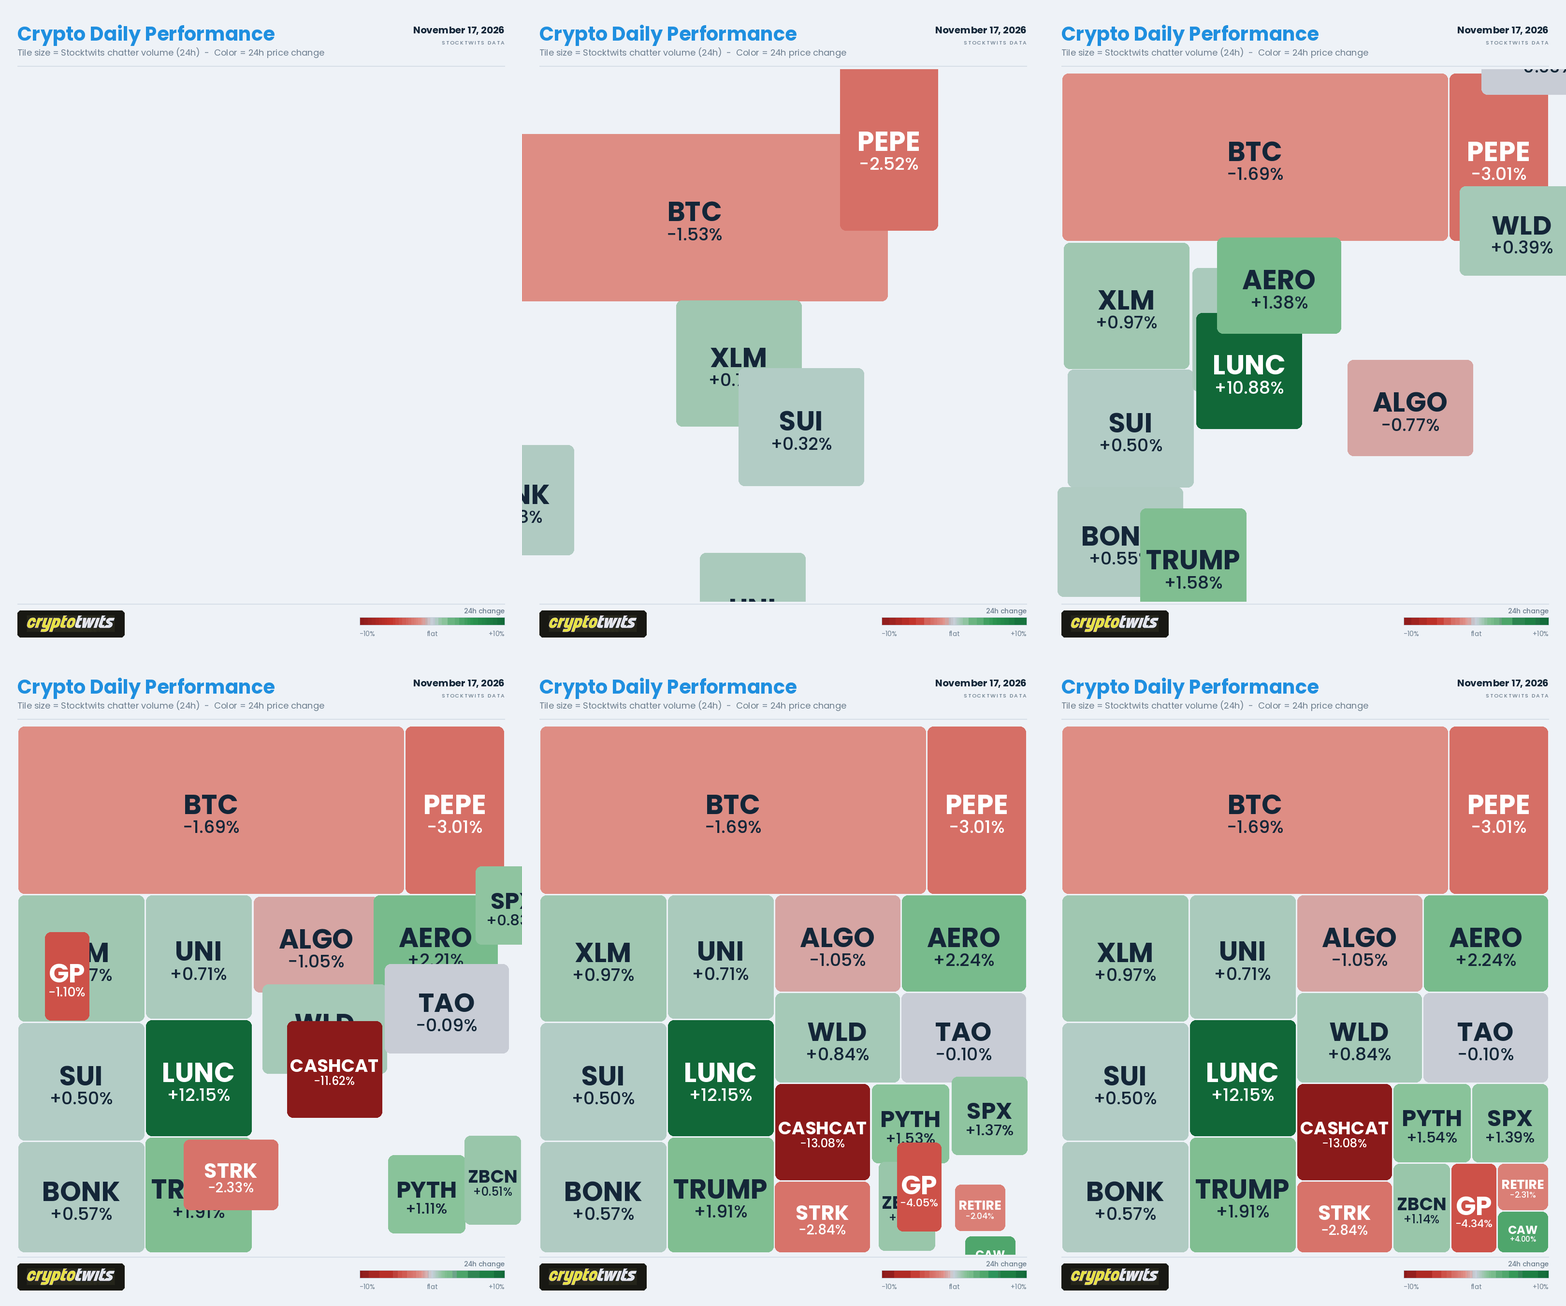
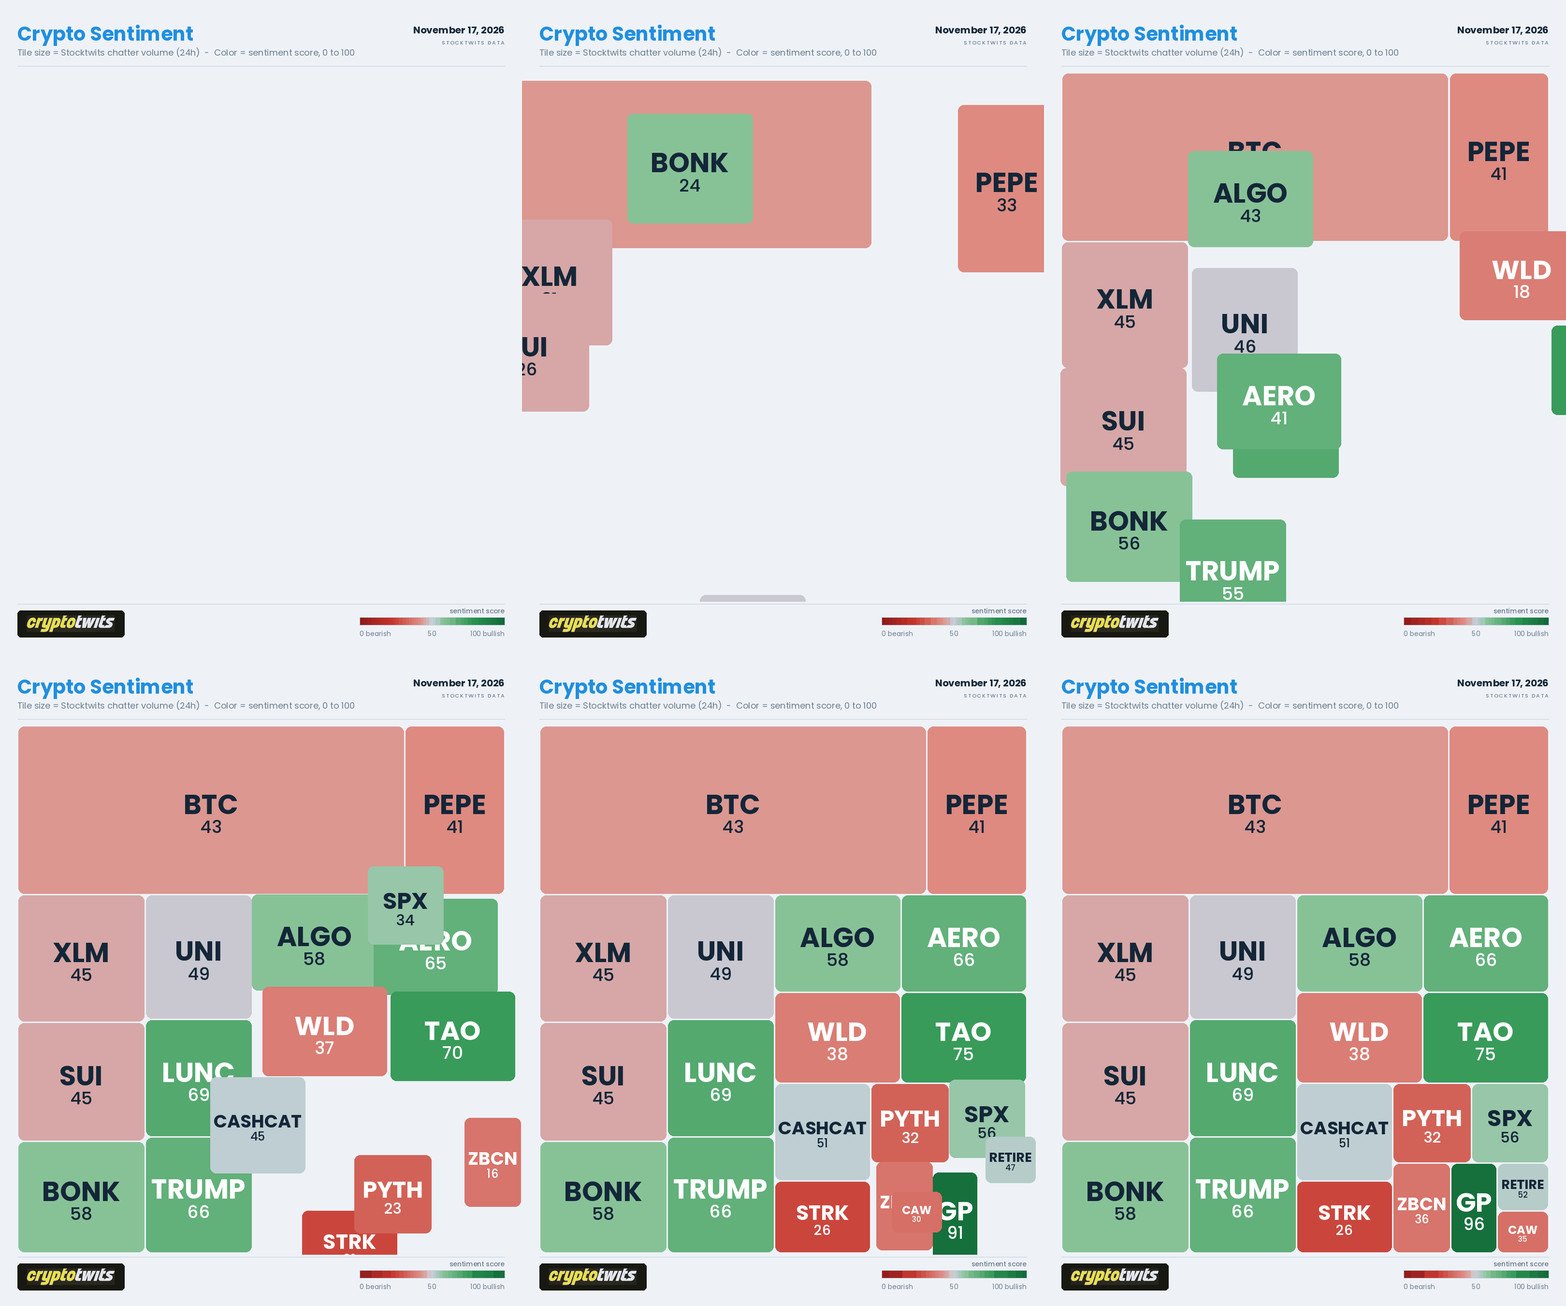
Here’s What’s Happening 👇
ON-CHAIN ANALYSIS
Five Coins, Six Boxes: Bottom Or More To Go? 📋
Today's issue is all about the On-Chain Bottom Conditions Scorecard, the checklist I built to answer the question, ‘is this market close to a bottom yet?’ It doesn't call bottoms or pick dates. But it does let me know if things are starting to look the same as the prior bottoms. 🪑
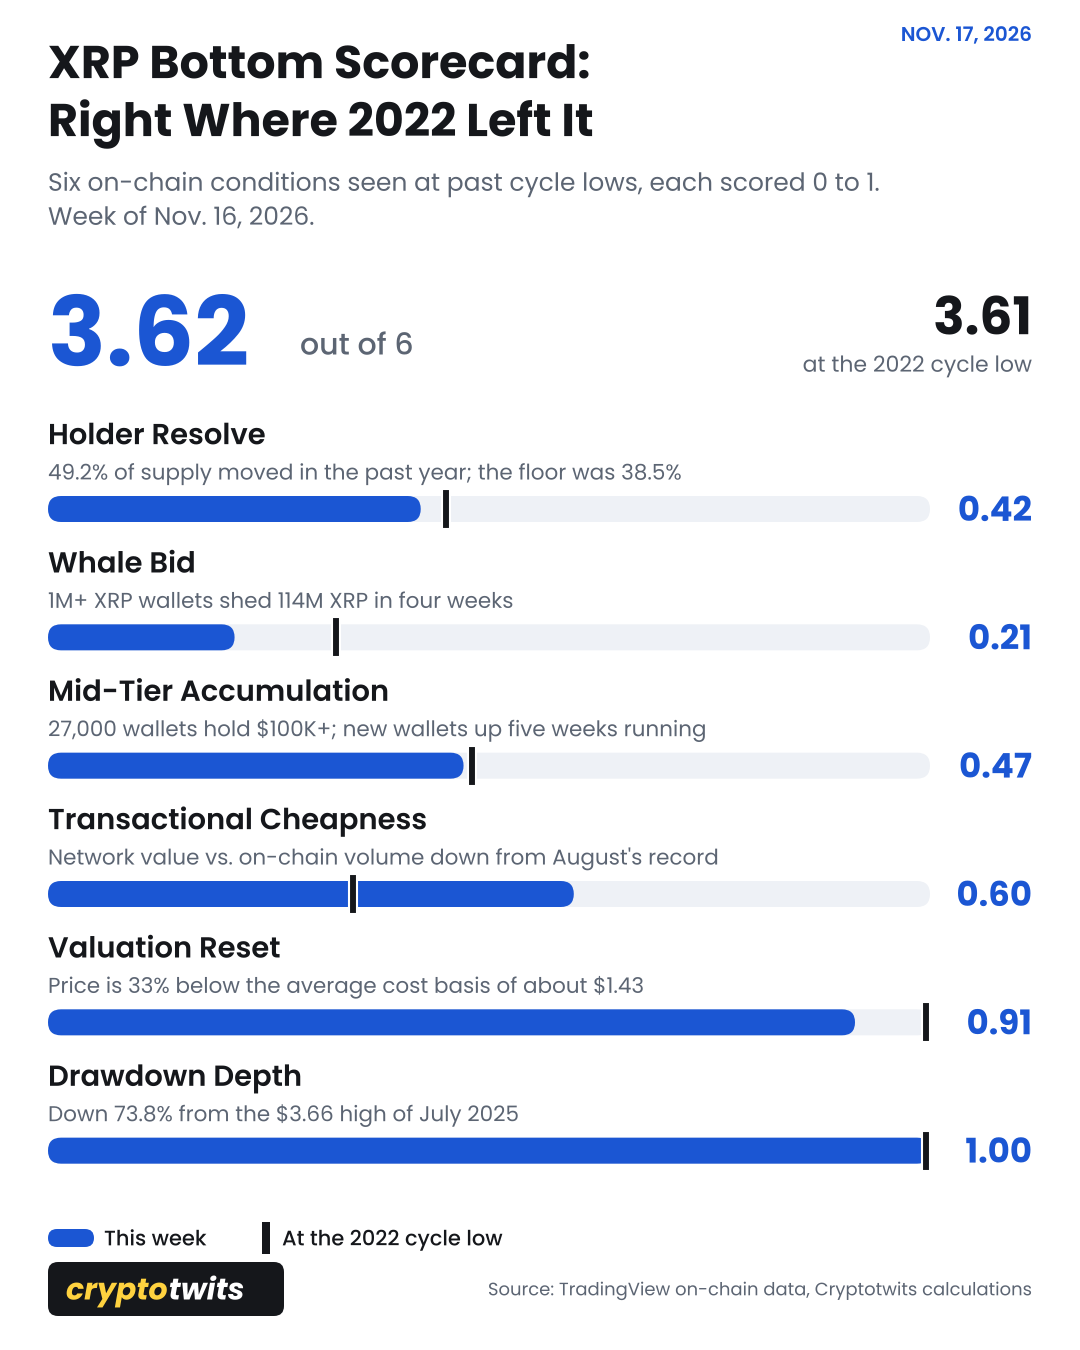
The six factors in the Scorecard:
Hodler Resolve: share of supply that moved in the past year. Stiller hodlers, higher score.
Whale Bid: are the biggest wallets adding?
Mid-Tier Accumulation: $100K+ wallets and new funded addresses.
Transactional Cheapness: network value against on-chain transfer volume.
Valuation Reset: price against the average price every crypto last moved at.
Drawdown Depth: distance from the cycle high.
The black tick on each chart marks where that coin scored at its 2022 cycle low.
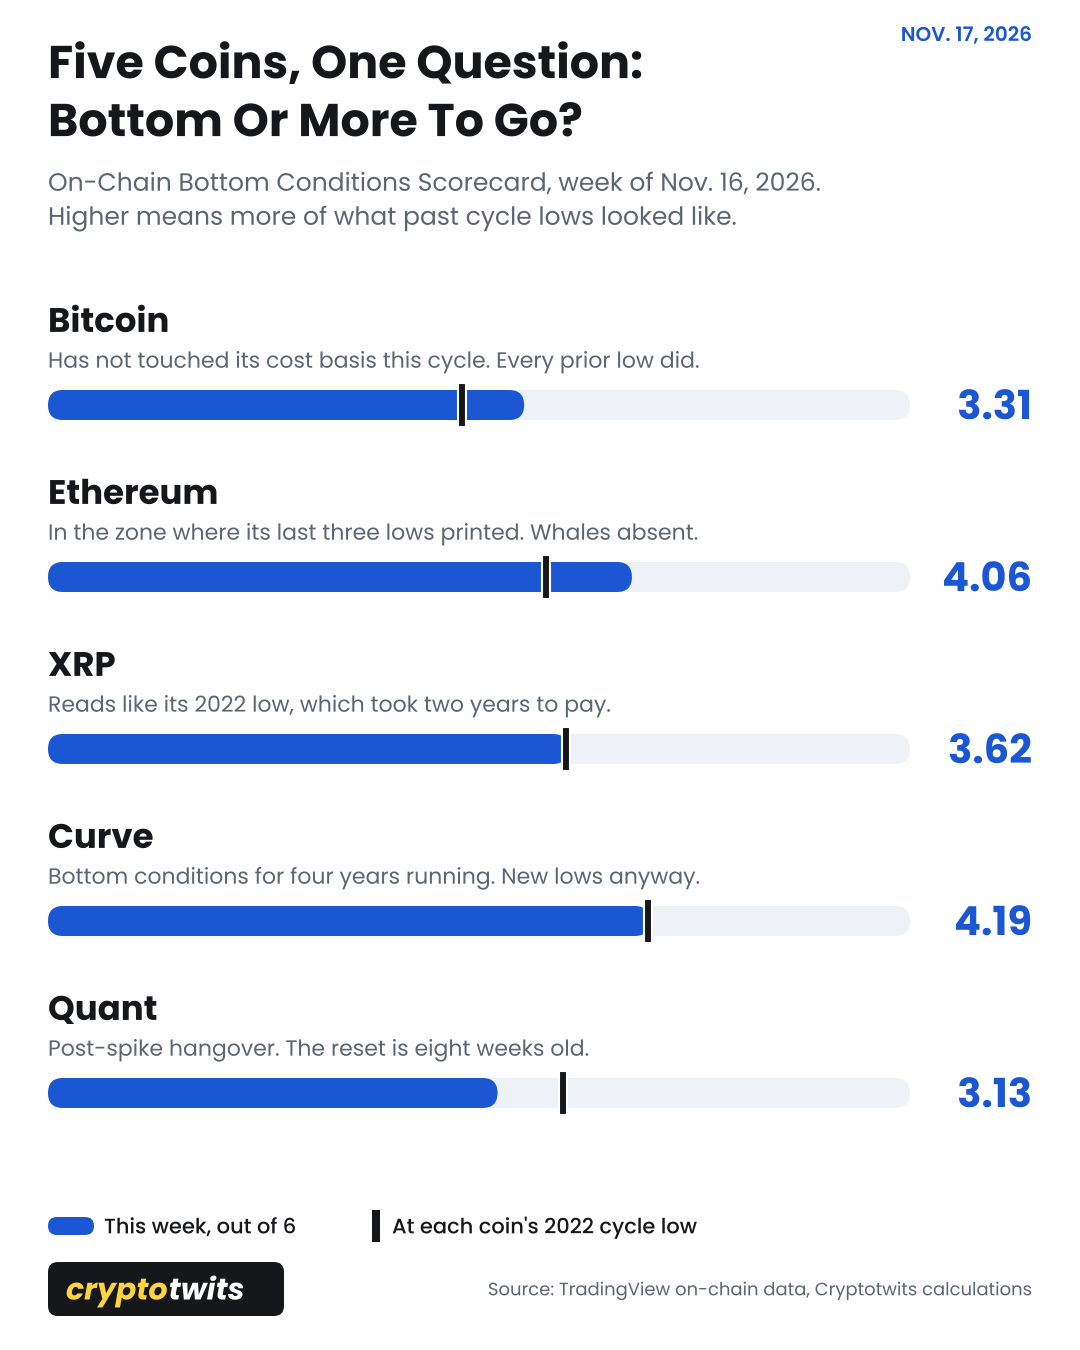
Also, I had today’s On-Chain Bottom Conditions Scorecard scheduled as a piece for this week a couple weeks ago. But those find folks at Glassnode beat me to it because they released their own piece today: Capitulation Meets Support, their read on whether Bitcoin’s bottom is in.
Their piece is worth a read. They ask whether last week's flush marked a local bottom. The scorecard asks whether this looks like a cycle low. 📇
The voice-to-text app that built its own speech model

Most dictation apps are a wrapper around someone else's speech model. Wispr Flow trained its own.
It's called Canto, and it was built for the way people actually talk to AI: thinking out loud, changing direction mid-sentence, half-whispering in an open office.
Wispr tested it on 10 hours of real dictations from more than 2,300 speakers. Canto had the lowest word error rate of every model tested, including models from Google, OpenAI, AssemblyAI and Deepgram. That means your prompts to ChatGPT, Claude and Cursor come through the way you said them.
Talk naturally in any app and Wispr Flow types clean, formatted text, 4x faster than typing.
ON-CHAIN ANALYSIS
Bitcoin (BTC): Best Score Of The Slide, One Box Still Empty 📦
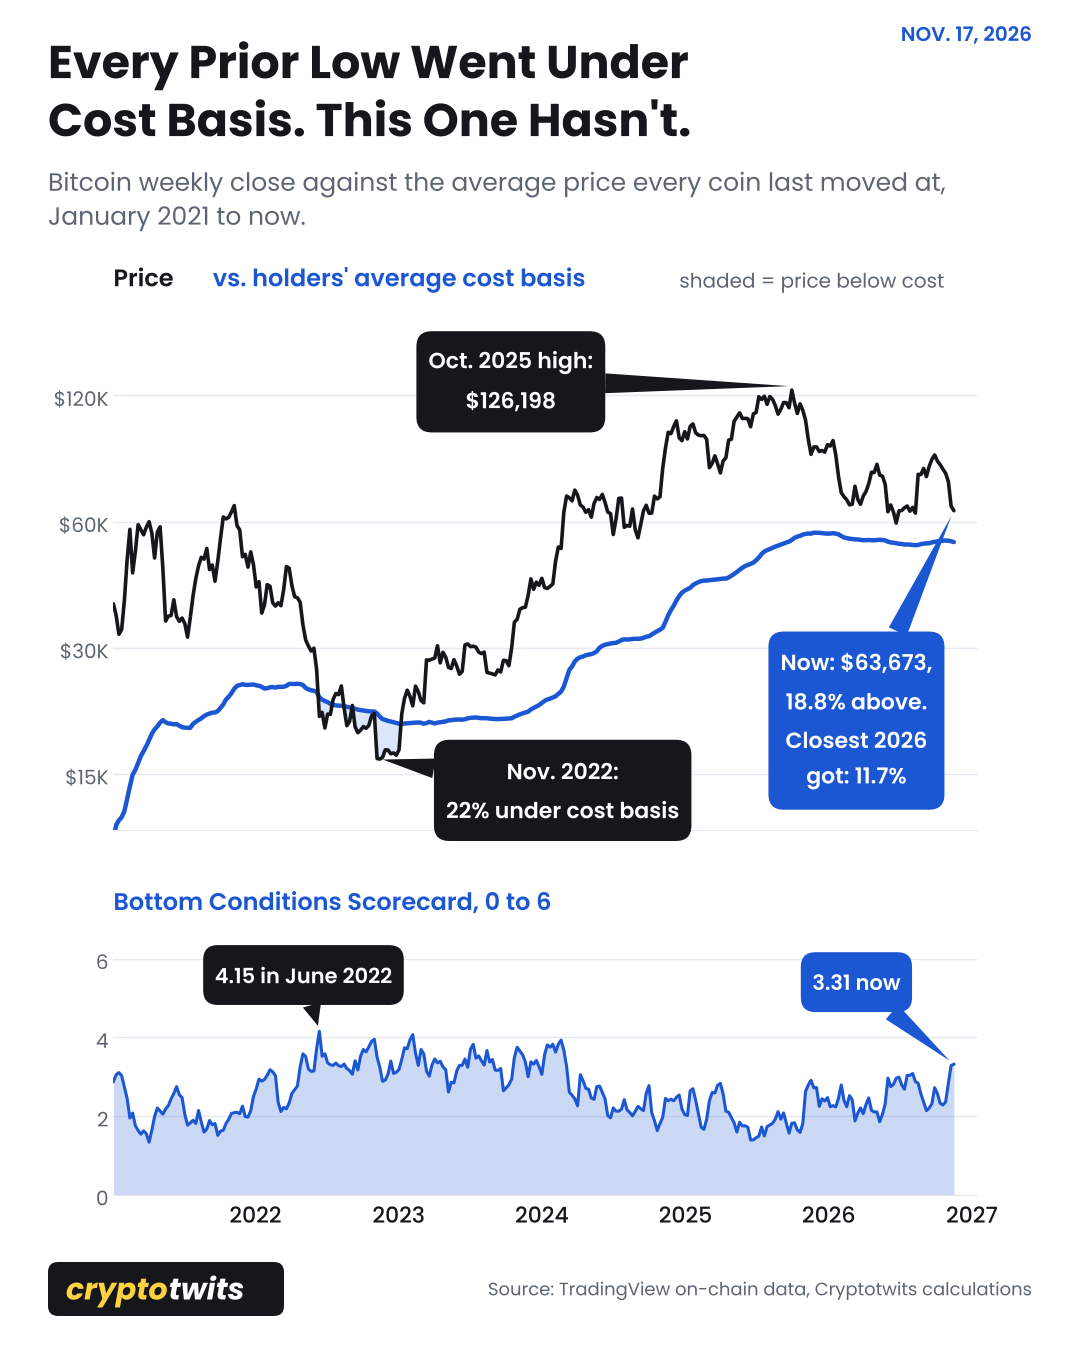
Bitcoin scores 3.31 out of 6, the best reading of the slide from October 2025's $126,198 high and the highest since February 2024. Three weeks ago it was 2.36. Falling from $78K to $63.7K will do that. So how much of the same furniture is in the room? Some of it. 🛋
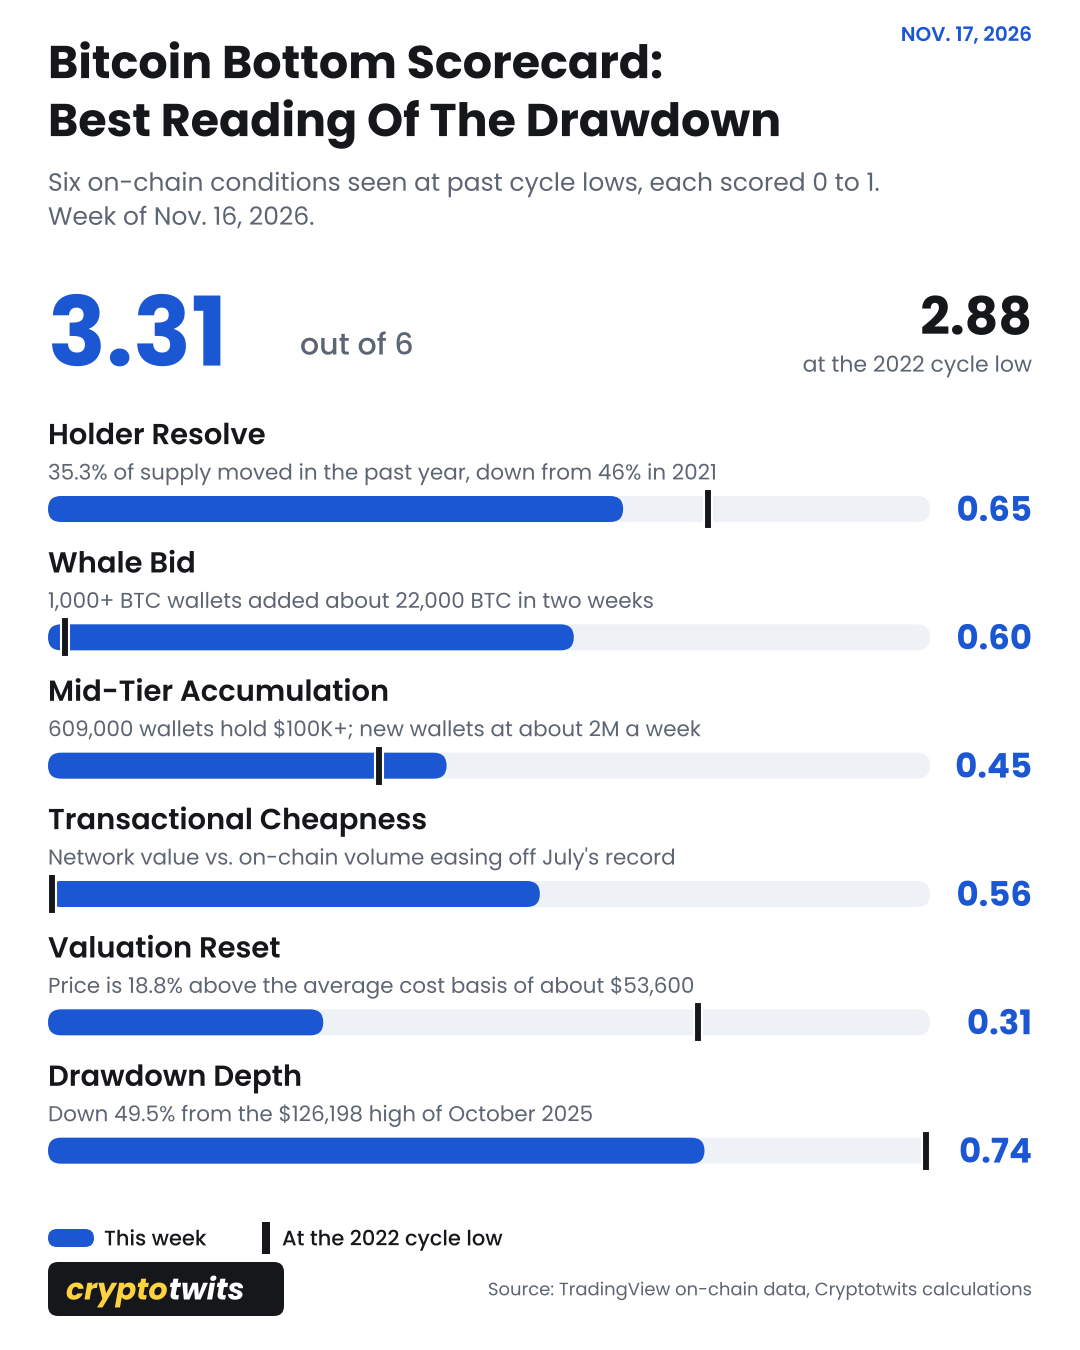
Holders are going still. 35.3% of supply moved in the past year, within two points of the November 2022 low.
The empty box is valuation. In 2022, BTC spent 25 weeks under the network's average cost basis and bottomed 22% below it. 2015 and 2018 went about 30% under.
Not much pain booked. Realized cap, the sum of what every coin last changed hands for, is down 4.3% from its November 2025 peak. In 2022 it fell 18.8%.
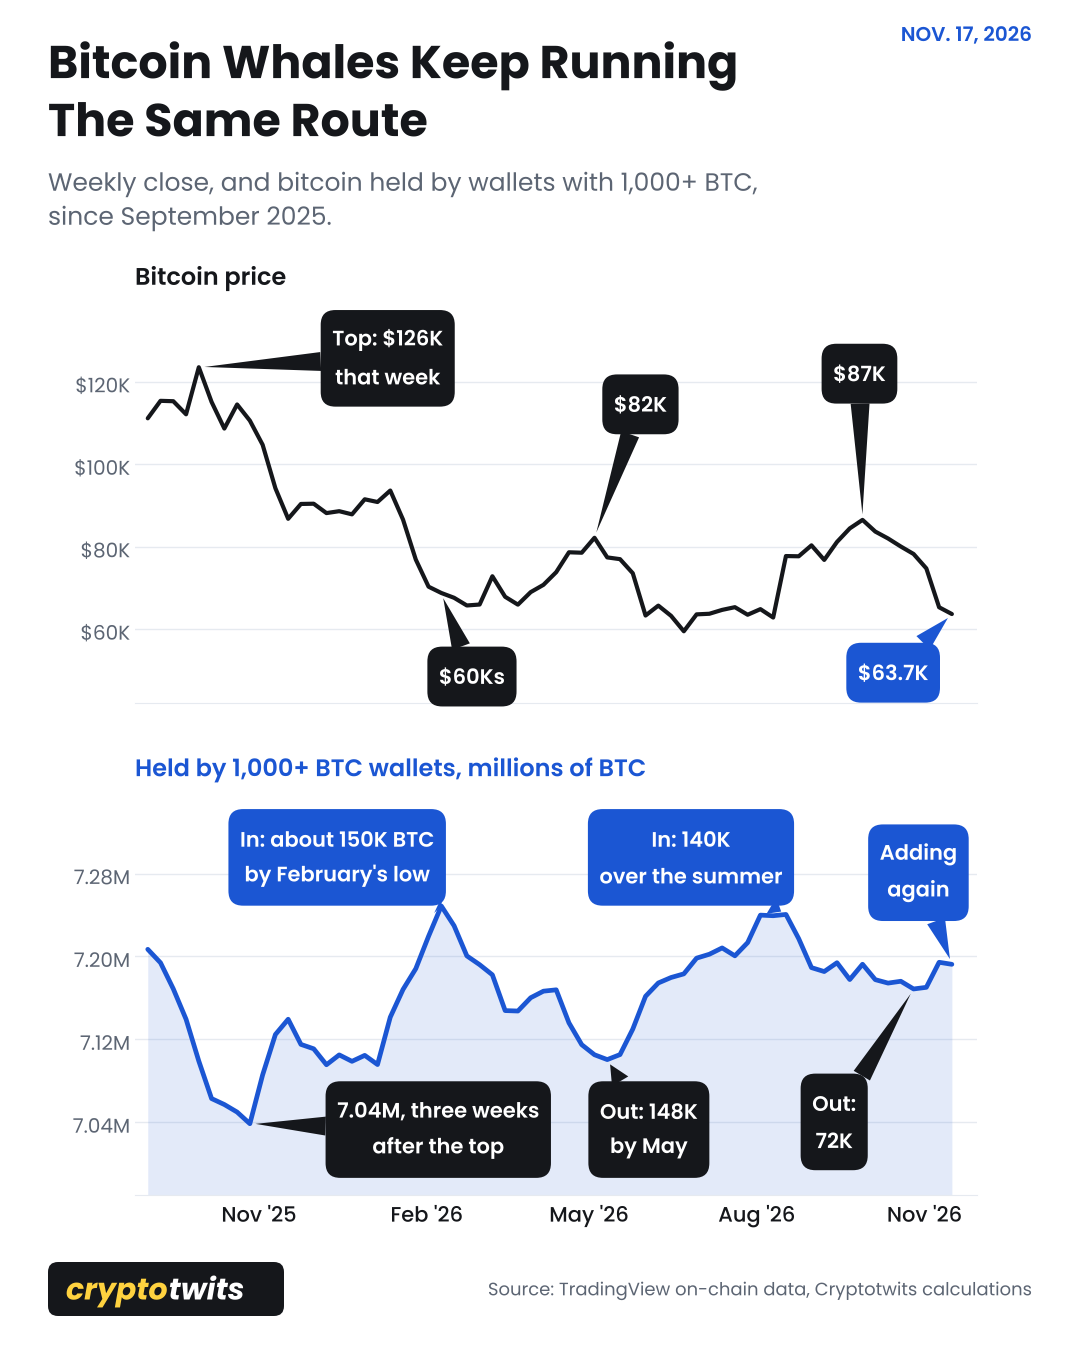
The whales run a delivery route. Wallets holding 1,000+ BTC bottomed at 7.04 million BTC three weeks after the top. Same stops ever since:
Winter: about 150,000 BTC in by February's low, about that much out by May.
Summer: 140,000 in, half of it out in October.
Past two weeks: about 22,000 BTC in, as price fell back to the mid-$60Ks.
Nobody new is showing up. New funded addresses run about 2 million a week against 3.1 million in 2021. Back then the bar had a line out the door. Now it's the bartender and two regulars arguing about the jukebox.
Bottom or more to go? Bitcoin hasn't put in a cycle low without dipping under cost basis, and this drawdown hasn't come within 8% of it. A 2022-sized discount lands near $42,000.
Maybe this is the cycle that breaks the pattern. The scorecard can't tell you that. The whales seem to have read it already. 🤔
ON-CHAIN ANALYSIS
Ethereum (ETH): Four Boxes Checked, Whales Not Buying It 🐳
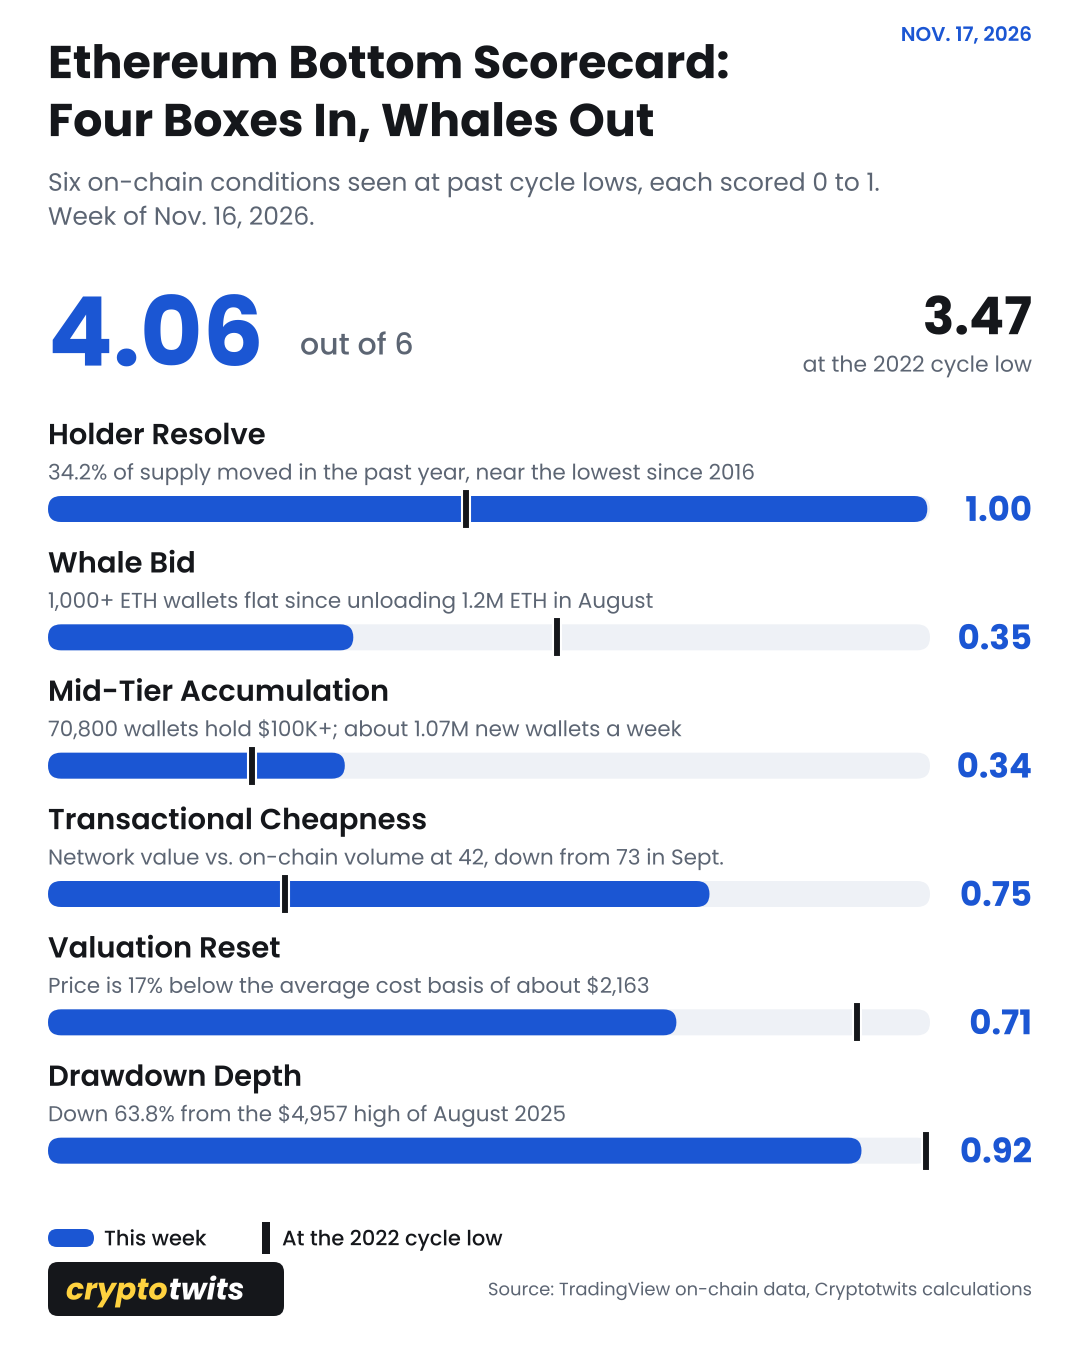
Ethereum scores 4.06 out of 6, with ETH at $1,795, 64% below August 2025's $4,957 high. Only 16 weeks since January 2021 scored higher, none in 2022, when the last bear market topped out at 3.94. 📊
What's Checked
Holders went Captain America in the ice. Just 34.2% of supply moved in the past year, near the lowest reading since 2016 and down from 62.5% in January 2021. Steve Rogers got more done down there.
Price is under cost basis. ETH trades 17% below its average cost basis of about $2,163 and has spent 29 of 46 weeks this year under it. The last three lows closed 20% to 34% under, which today means about $1,730 down to $1,430.
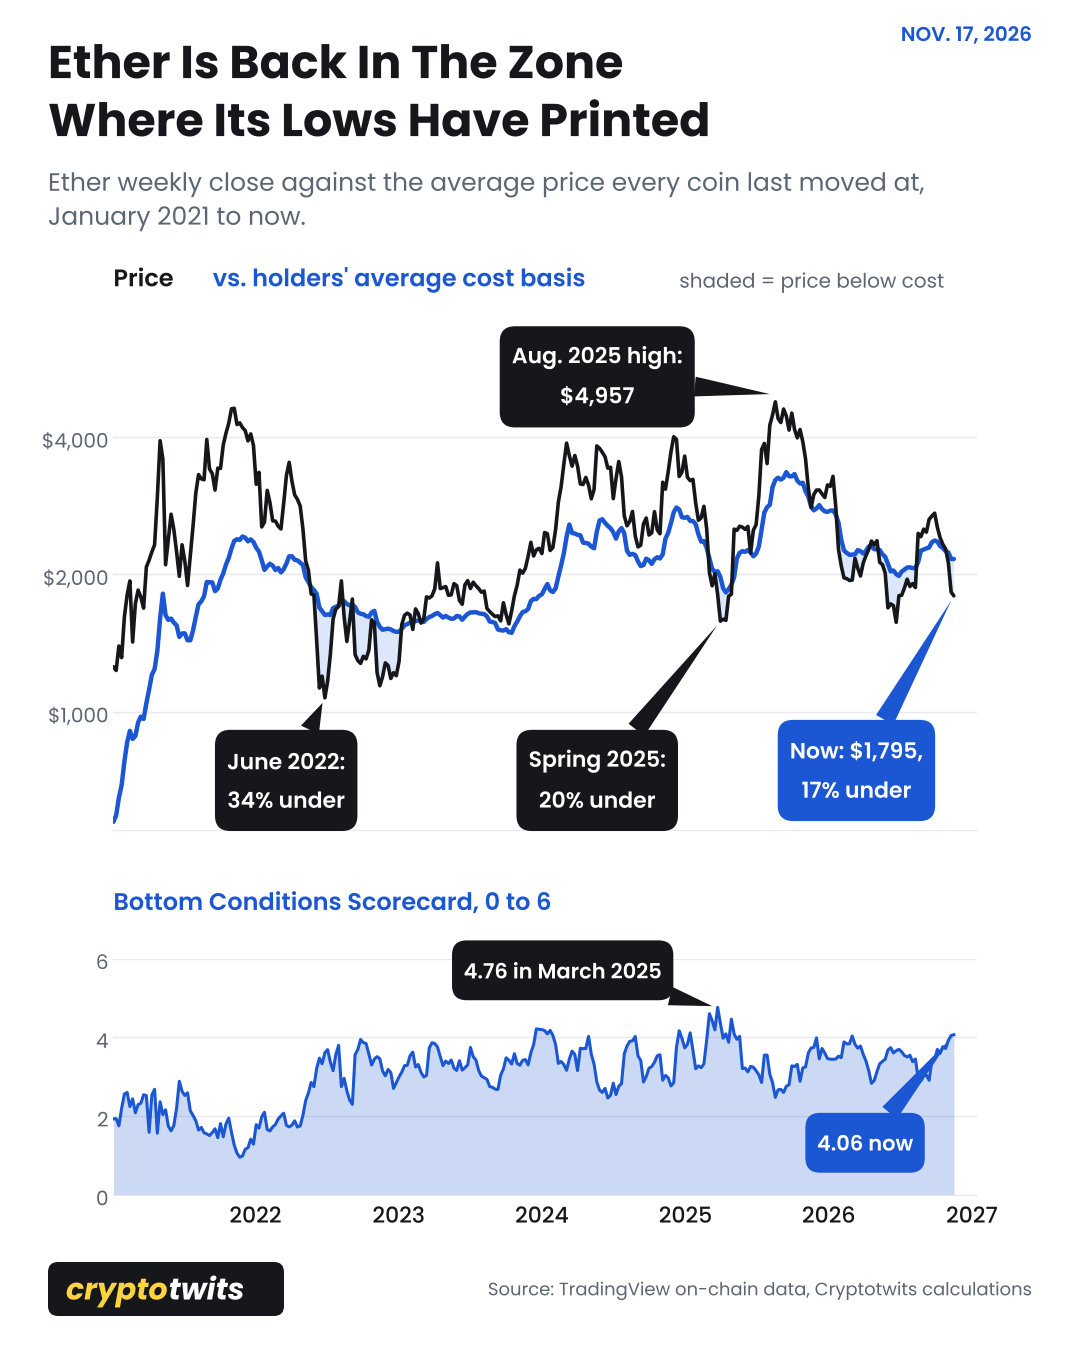
Markdown is taken. Realized cap is down 35% from its September 2025 peak. The whole 2021-2023 bear took it down 38%.
Volume is back. RVT, network value against on-chain transfer volume, fell from 73 in September to 42. On the way down, that's people leaving, and people leaving is what lows are made of.
What Isn't
The whales. Wallets holding 1,000+ ETH added about 800,000 ETH into the June low, then unloaded 1.2 million in two weeks of August as price ripped 31%. They've barely budged since.
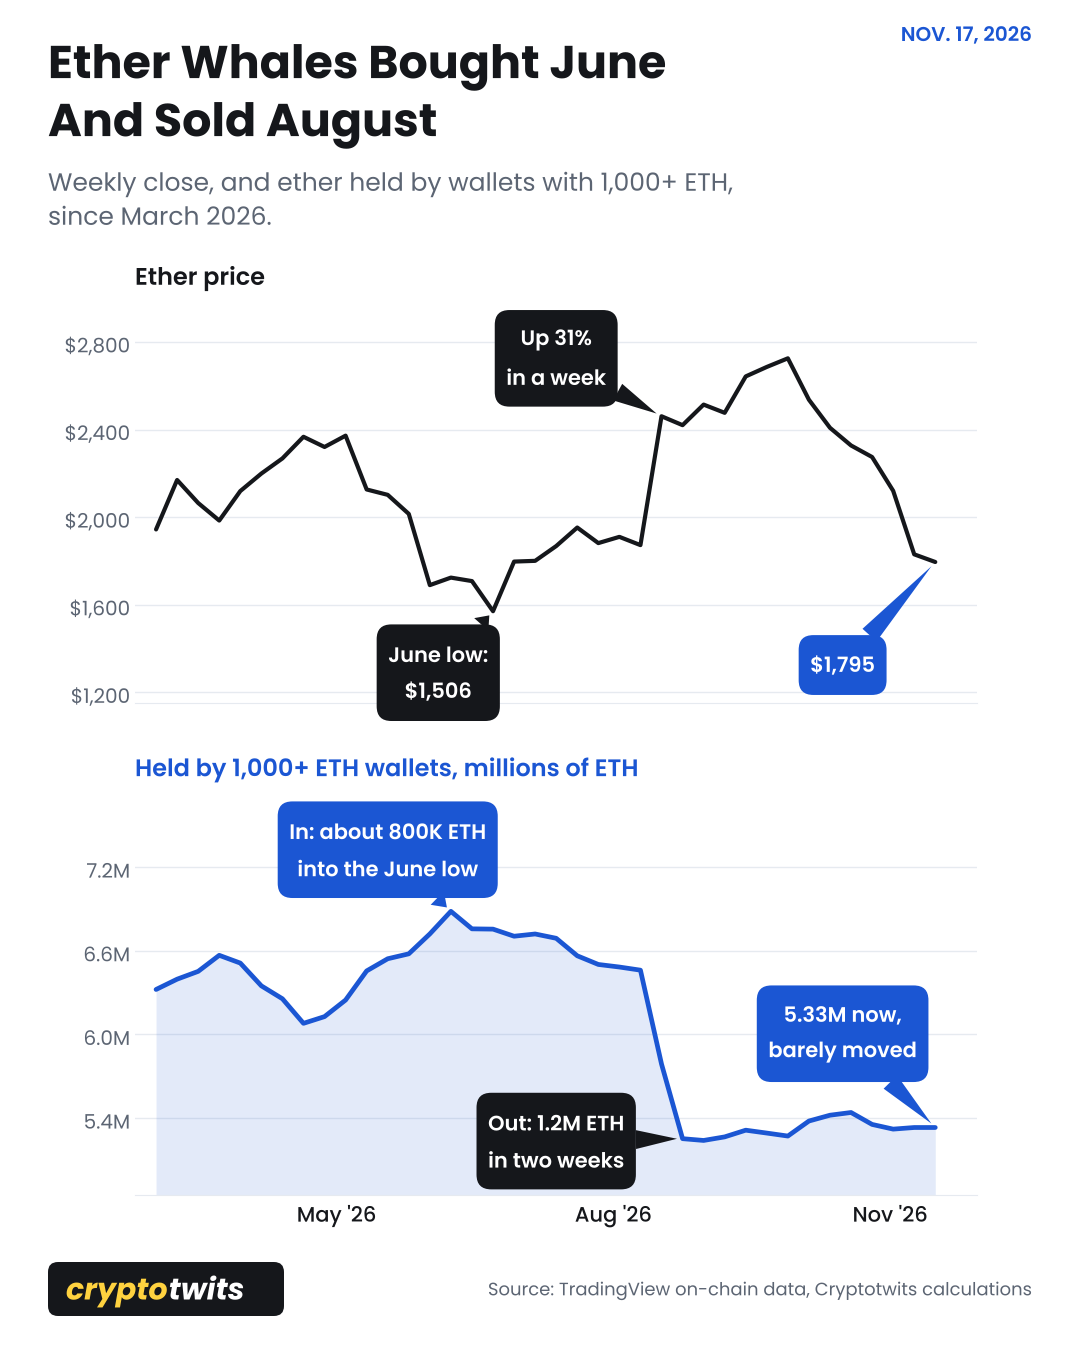
New wallets, with an asterisk. About 1.07 million a week. January's record 2.7 million week was address-poisoning spam made cheap by the Fusaka upgrade.
Bottom Or More To Go?
This is what the neighborhood of a low has looked like. June's $1,506 low sits inside a discount zone that starts about 4% below here. Bulls are likely looking for long opportunities from $1,730 down to $1,430. A weekly close under $1,430 would be a deeper discount than 2022 ever printed.
One pattern worth a look. The scorecard ran this high around New Year's 2024 and again from December 2024 into May 2025, and ETH rallied after both, 258% the second time. 😯
ON-CHAIN ANALYSIS
XRP: Back Under A Dollar, And It Looks A Lot Like 2022 ⏪
XRP printed $0.893 last week, its lowest since November 2024 outside one flash-crash wick, and sits at $0.958, 74% off July 2025's $3.66 high. The scorecard reads 3.62, higher than roughly seven of every ten weeks since January 2021. 😶
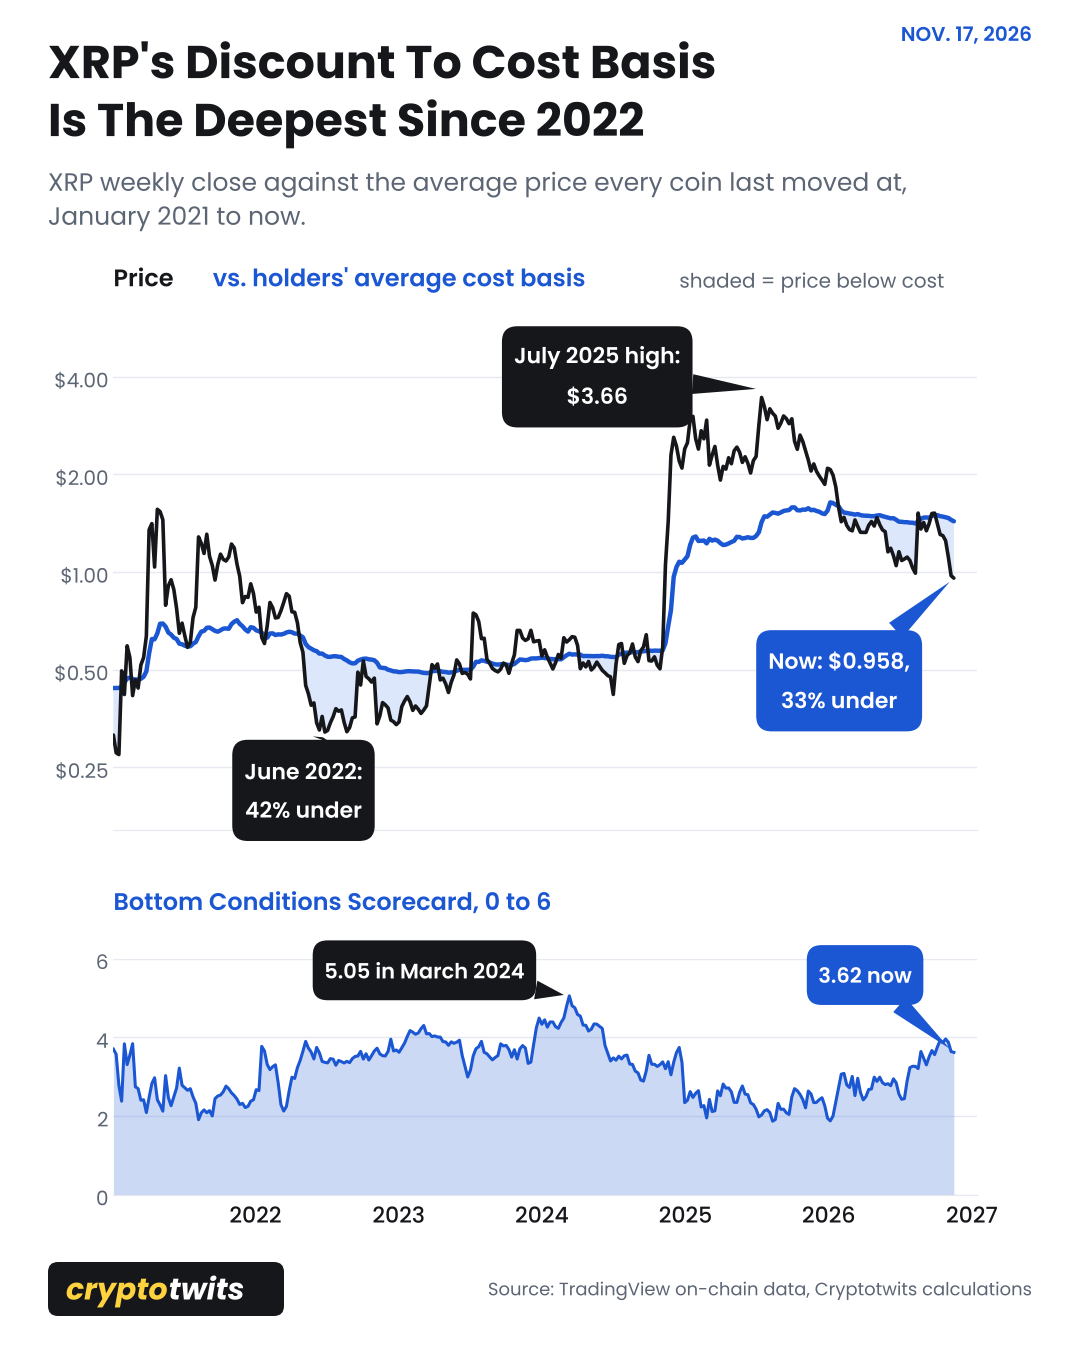
How deep is the hole? Deep. XRP trades 33% below its average cost basis of about $1.43. Only 13 other weeks since 2021 were that far under: the SEC-lawsuit panic, summer 2022 and FTX week.
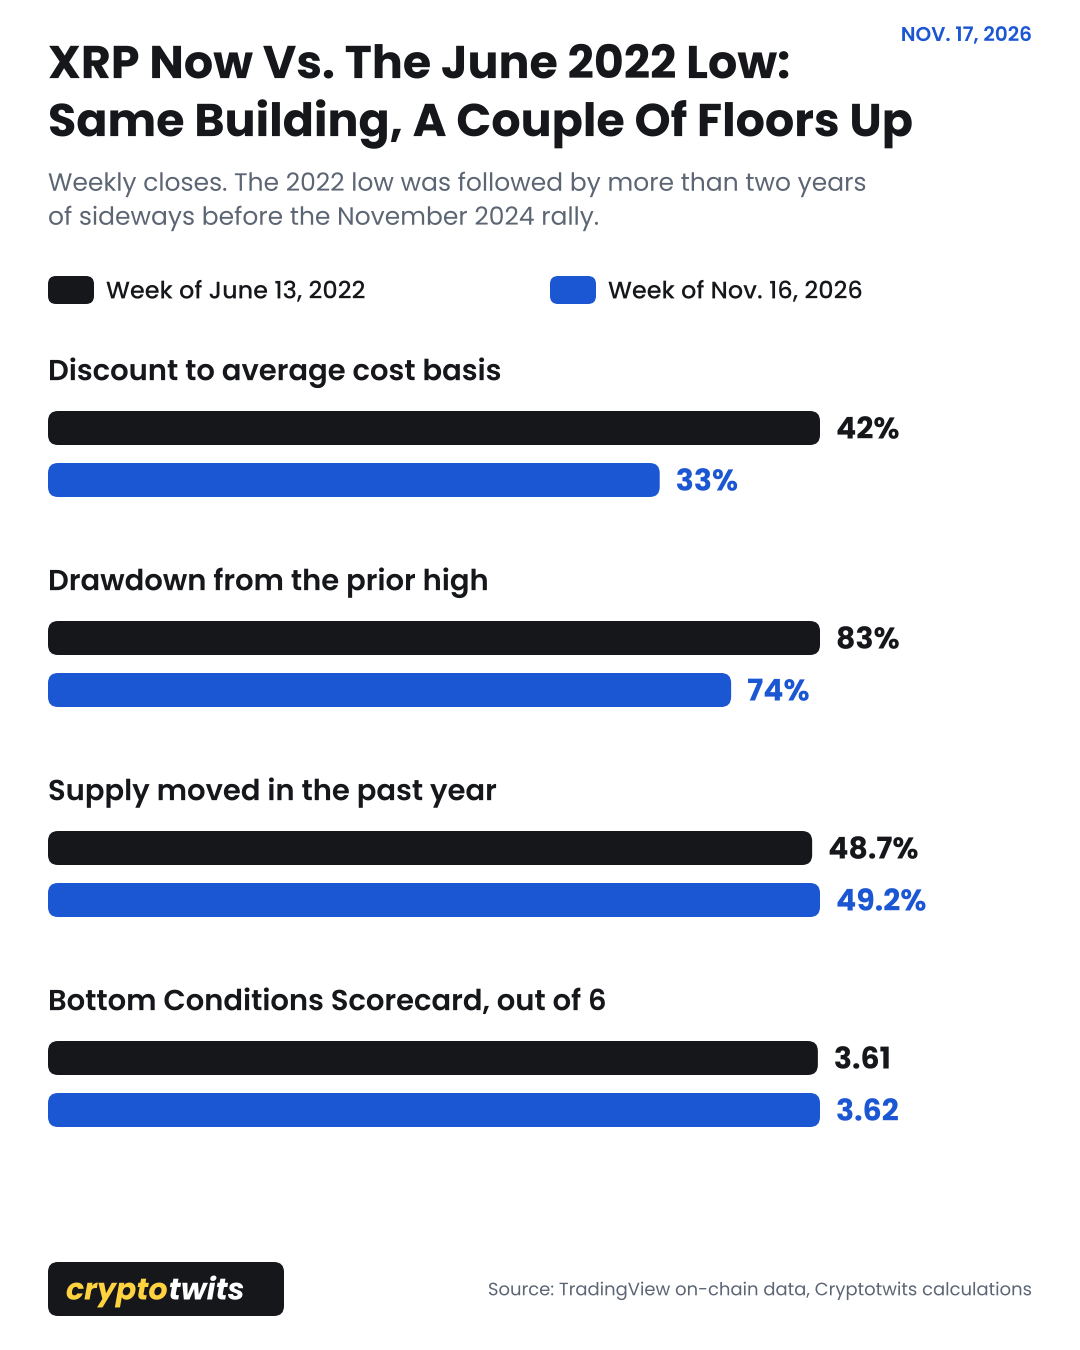
Same building as 2022, a couple of floors up. At the June 2022 bottom: 42% under cost basis, 83% off the high, 48.7% of supply active. Today: 33%, 74% and 49.2%. A 2022-sized discount works out to about $0.83.
Shade the discount a little. Around New Year's, old coins moved at about $2 and lifted the average cost basis about 13 cents. Some of today's discount is bookkeeping.
Small fish are buying. New funded addresses climbed five weeks running, from about 20,000 to nearly 40,000. Wallets holding $100K+ fell to 27,000 from 114,000 at the peak, still nearly double the count before the November 2024 rally.
Big wallets are selling. Addresses holding 1 million+ XRP shed 114 million XRP in four weeks, about 2.5 times this year's usual pace, right as price lost the dollar. Ripple's escrow lives in that pile, so treat it as a tide and not a signal. It's going out faster.
Bottom or more to go? On valuation and drawdown, this is what XRP's last cycle low looked like.
The catch: after June 2022, XRP spent 120-odd weeks closing between $0.32 and $0.75 while the scorecard averaged 3.76. 🚶
ON-CHAIN ANALYSIS
Curve (CRV): The Scorecard Has Said Bottom Every Year Since 2022 🔁
Curve scores 4.19 out of 6, higher than nine of every ten weeks since January 2021, with CRV at $0.203, 97% below its 2022 high and 20% above June's $0.170 all-time low. On paper it's acing the test. The trouble is how long it's been acing it. 🎯
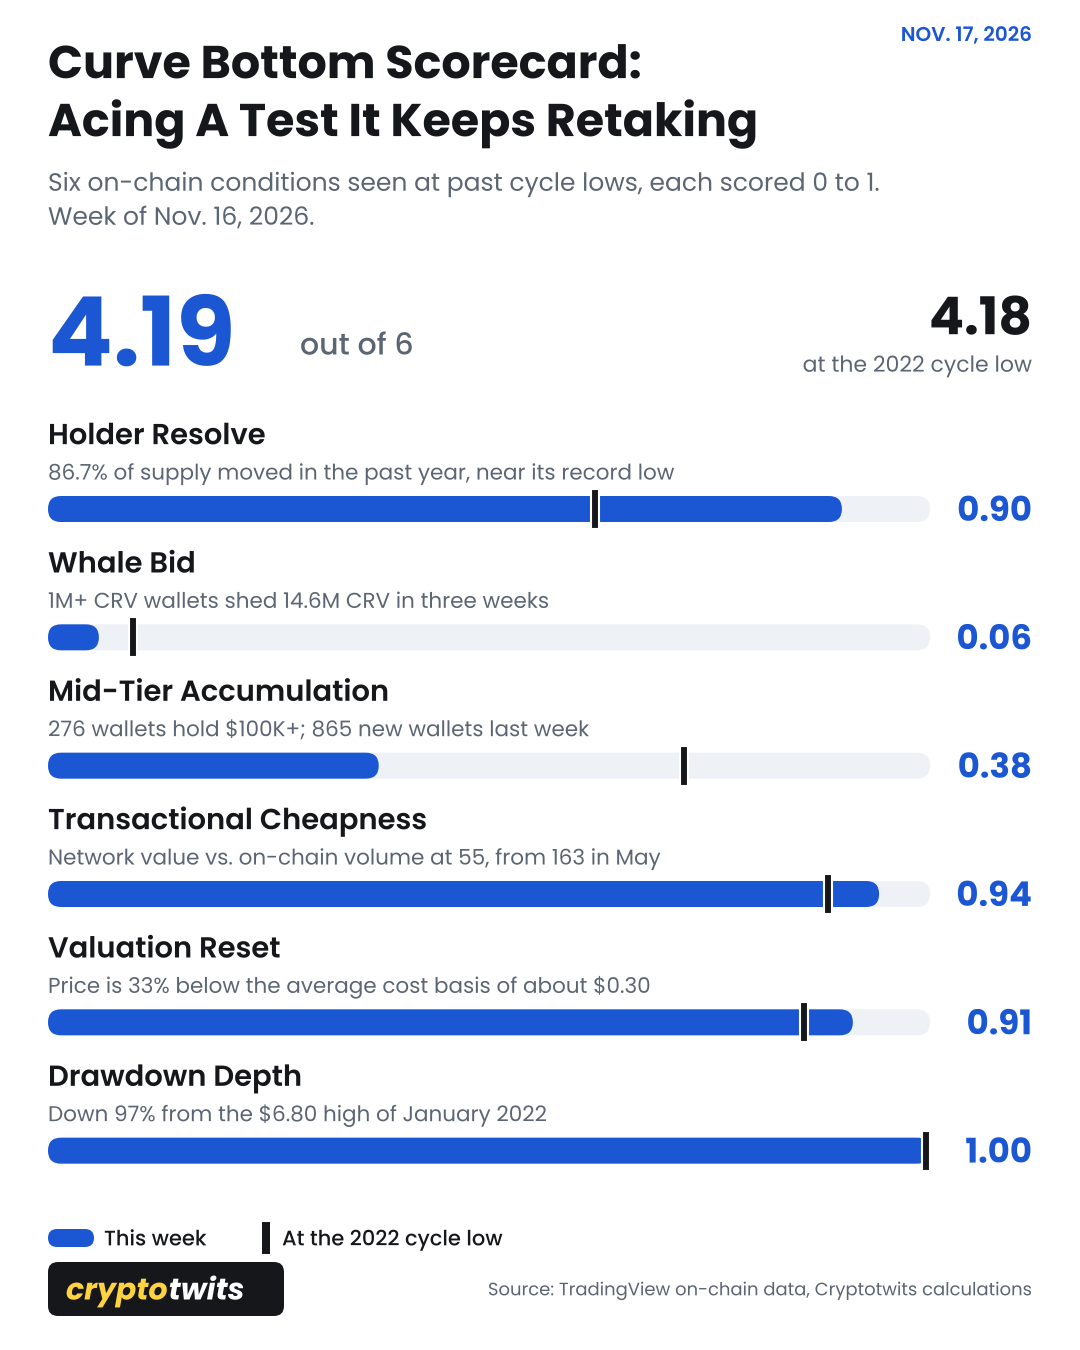
This token lives in bottom conditions. CRV has traded under its average cost basis in 239 of 307 weeks since January 2021, including every week of 2022 and 2026. For most coins, that's the emergency. For Curve it's the mailing address.
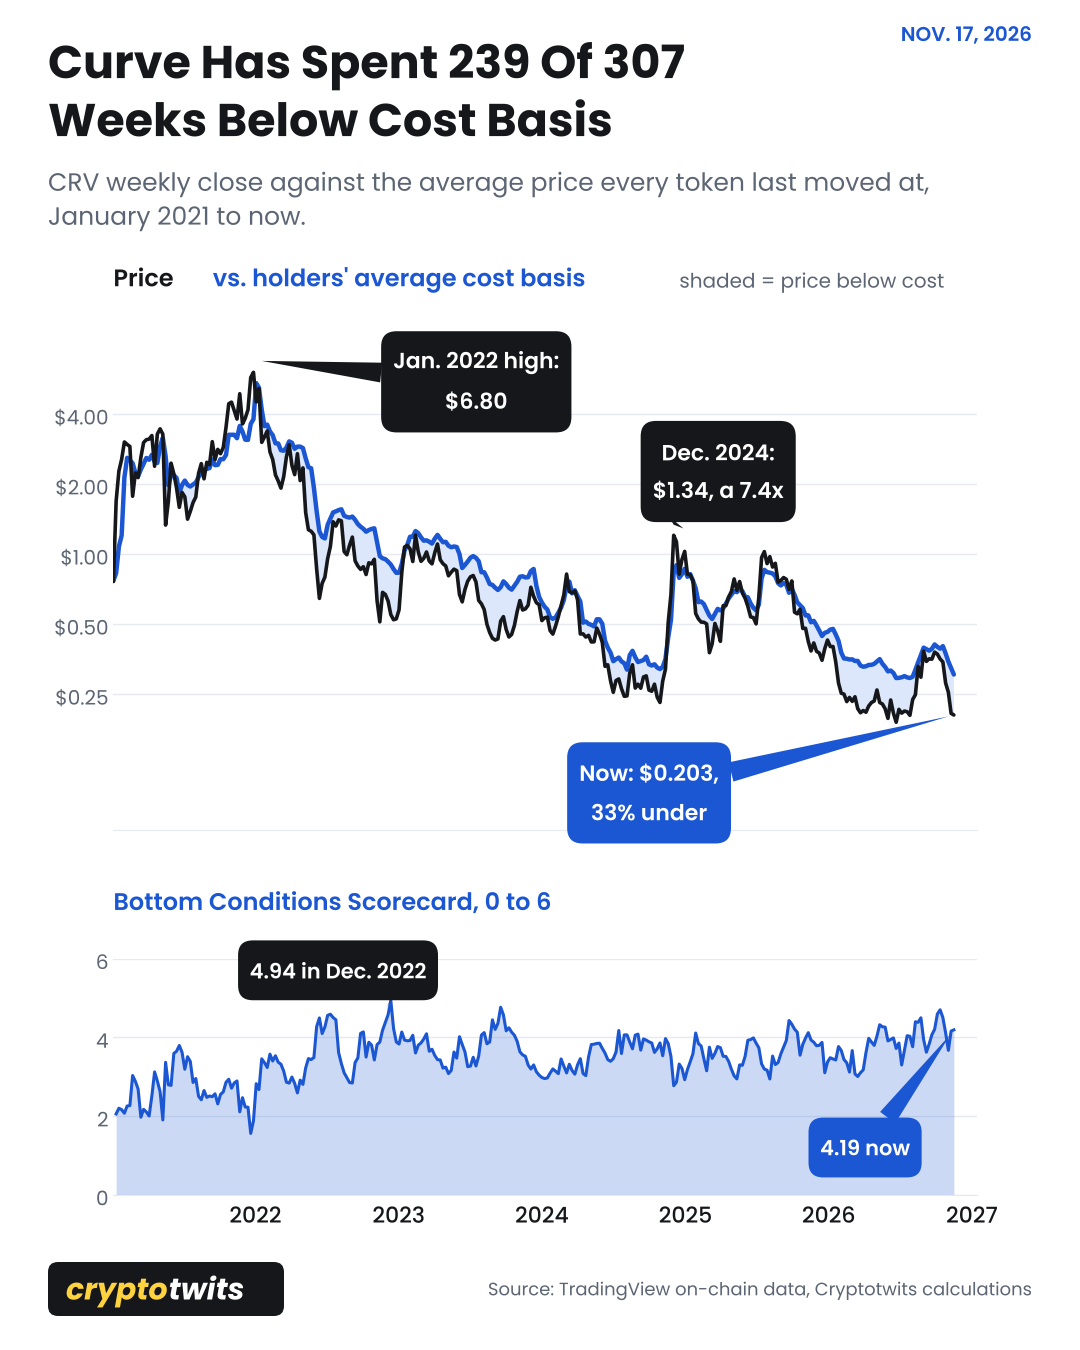
It's Edge of Tomorrow with a smaller budget. Live, die, repeat, each reset a little lower. The scorecard has averaged 3.5 or better every year since 2022 while the yearly low fell from $0.40 to $0.17.
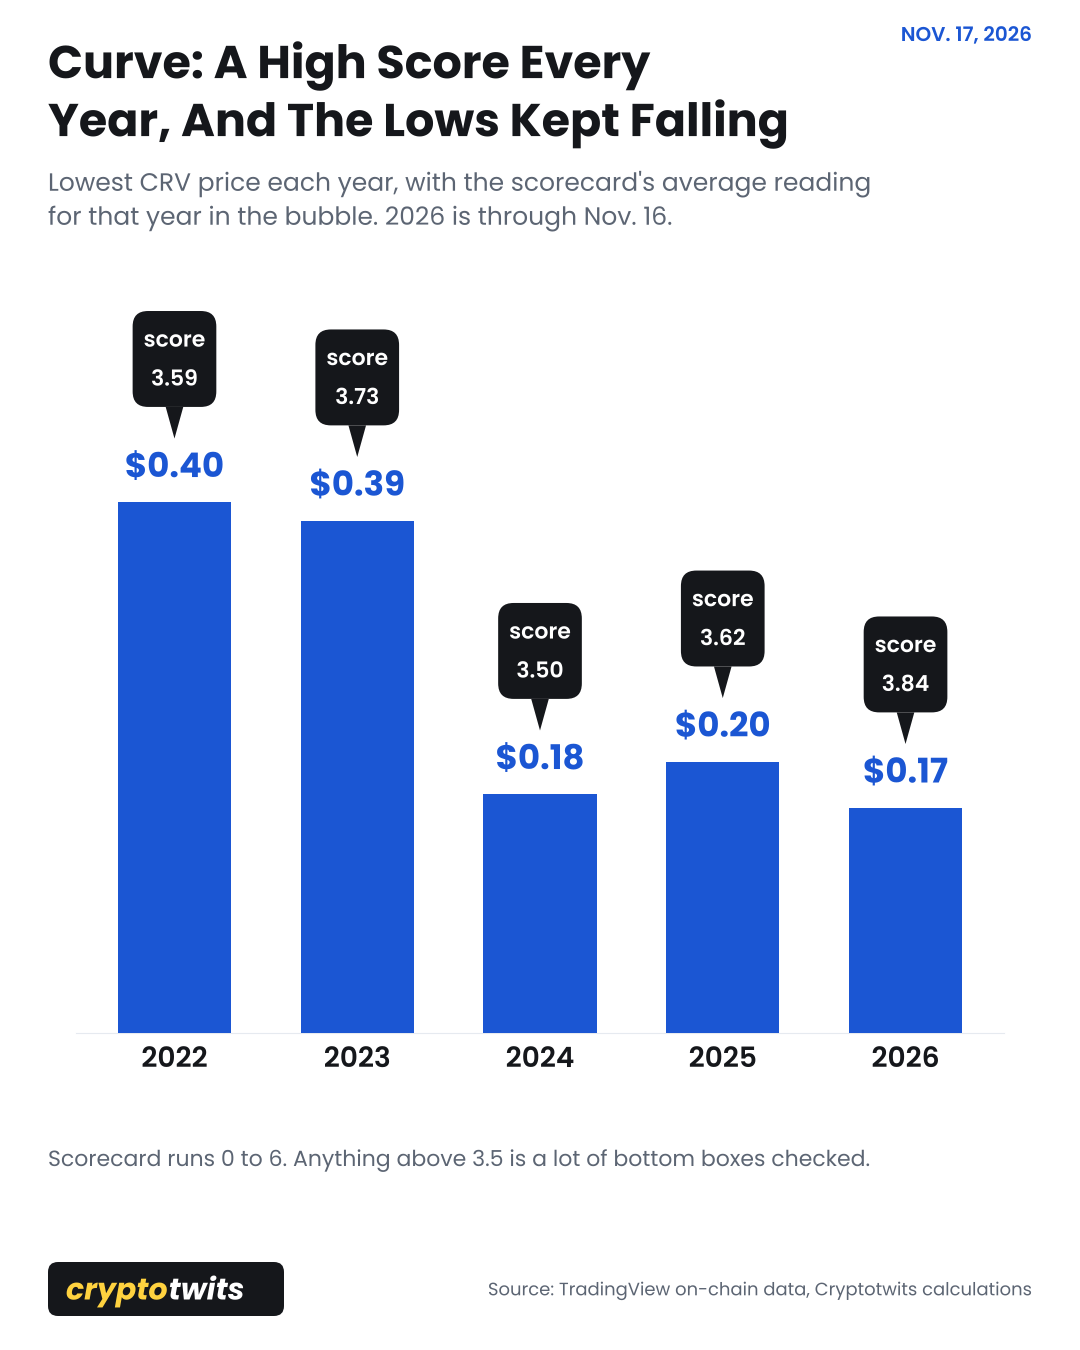
Why the score stays high: emissions grew the token count about 70% since 2021, so price leaks while the boxes stay checked. Realized cap has fallen from $9.05 billion to $742 million, and a quarter of what was left walked out in the past seven weeks.
The whales flinched. Wallets holding 1 million+ CRV almost never shrink, since emissions pile up there. They shed 14.6 million CRV in three weeks from mid-October, a drop matched only when the founder's CRV-backed loans got liquidated in June 2024.
Volume is improving. RVT fell from a record 163 in May to 55. When CRV bounces off readings like these, it isn't polite: the August 2024 low at $0.18 hit $1.34 by December. Then it gave every cent back.
Bottom or more to go? June's $0.170 is the line. Bulls are likely looking for long opportunities while it holds. A weekly close under it is all-time-low territory with no history to lean on.
The scorecard measures holder pain and Curve mints that weekly. 🤕
ON-CHAIN ANALYSIS
Quant (QNT): Now The Scorecard Is Grading A Hangover 🥴
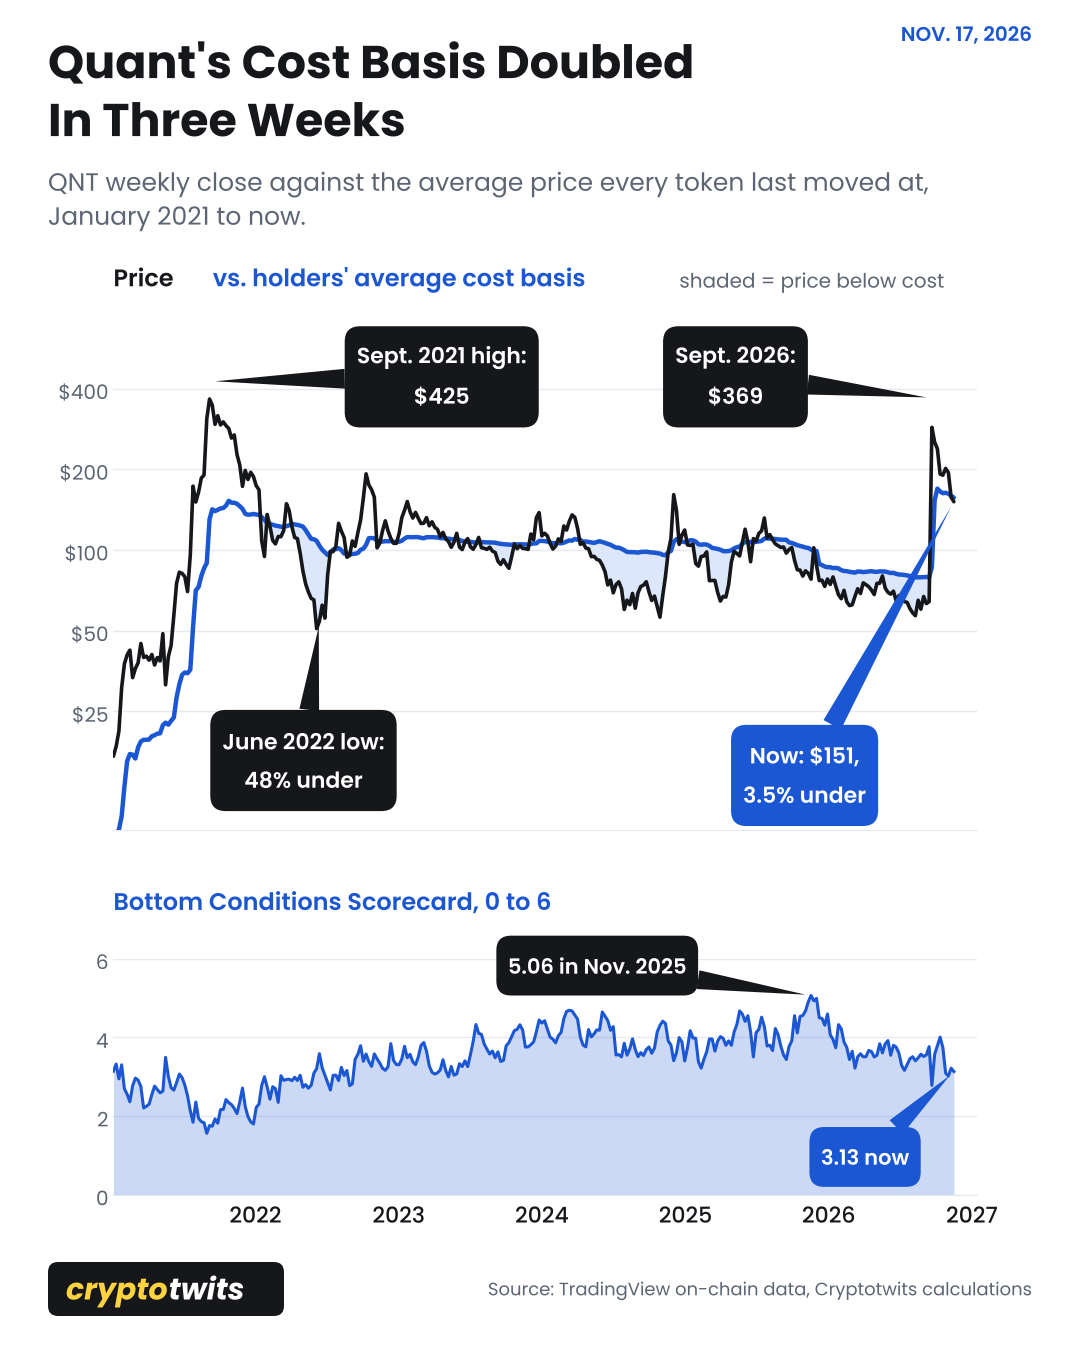
Quant is at $151, down 59% from $368.71 eight weeks ago, and its scorecard reads just 3.13. About seven of every ten weeks since January 2021 scored higher. A fresh 59% drop usually pushes the score up. Here the spike wiped the slate first. 🧑🏫
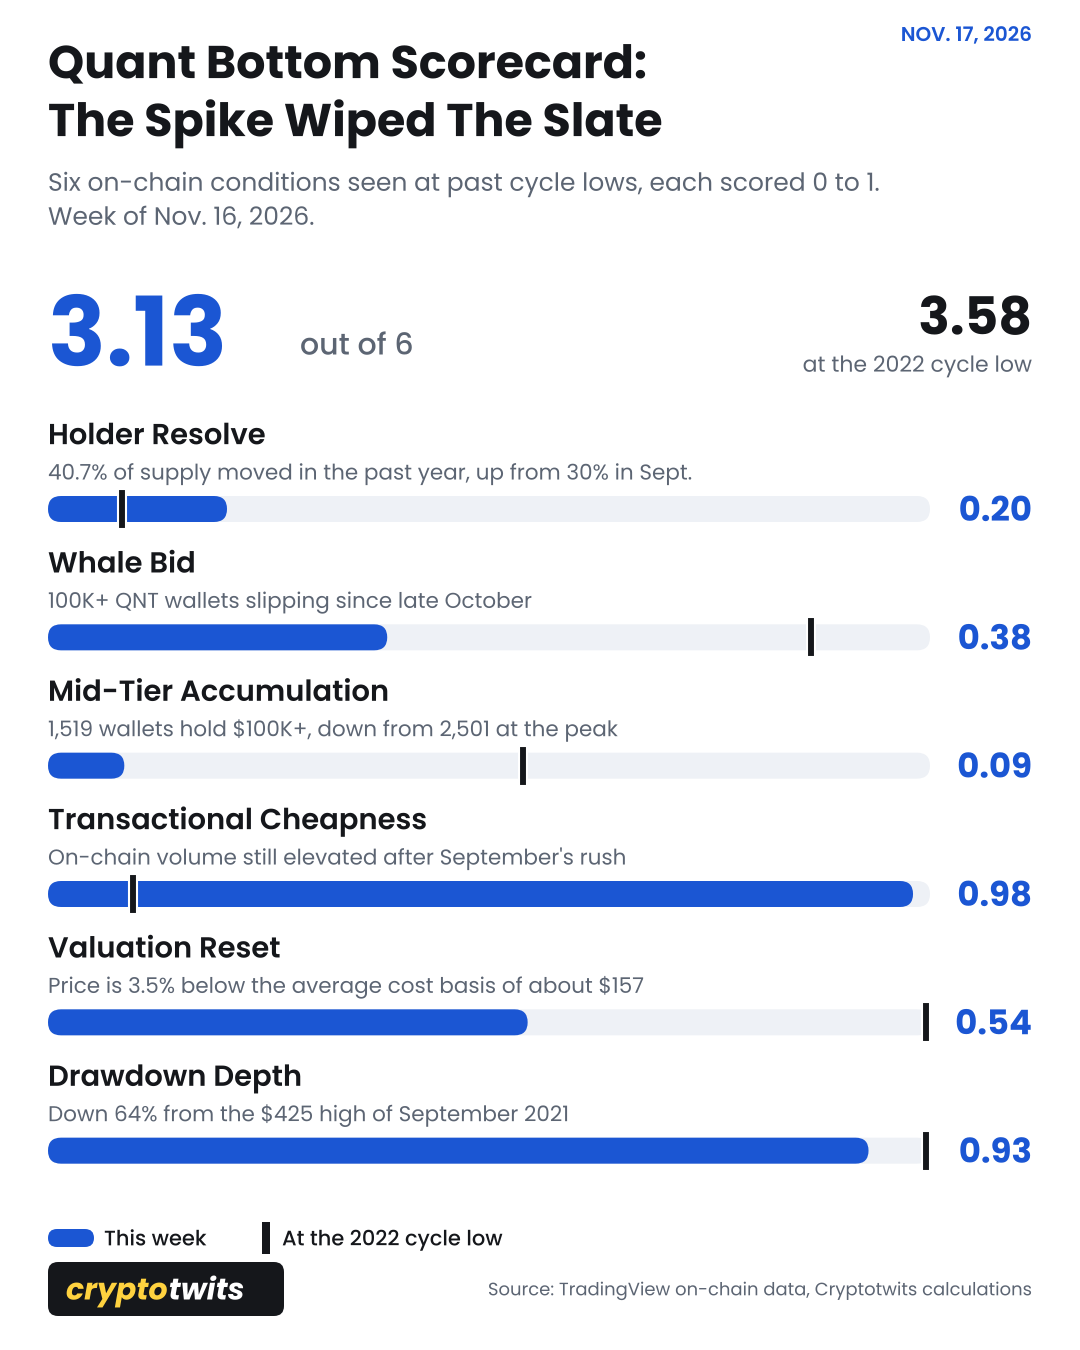
Before
Best reading on the board: 5.06 in November 2025, with QNT at $78, the top score of any week since 2021. Price still slid another 31%, to $53.70, by February.
One odd week. In early December 2025, wallets holding 100,000+ QNT added 1.2 million tokens in seven days as old, expensive coins got marked down at $77. Somebody large took the other side, nine months before the banks.
The quietest week on record. In mid-September RVT hit 609, the highest in the file.
After
On Sept. 24, The Clearing House, owned by 25 large US banks, picked Quant for its tokenized-deposit project, and UK Finance went live with tokenized sterling on a Quant-built platform. QNT ran from $64 to $287 in a week.
New funded addresses: 23,757 in one week, nearly double the old record from FTX week.
Wallets holding $100K+: nearly quadrupled.
Realized cap: more than doubled in three weeks, dragging the average cost basis from $79 to about $157.
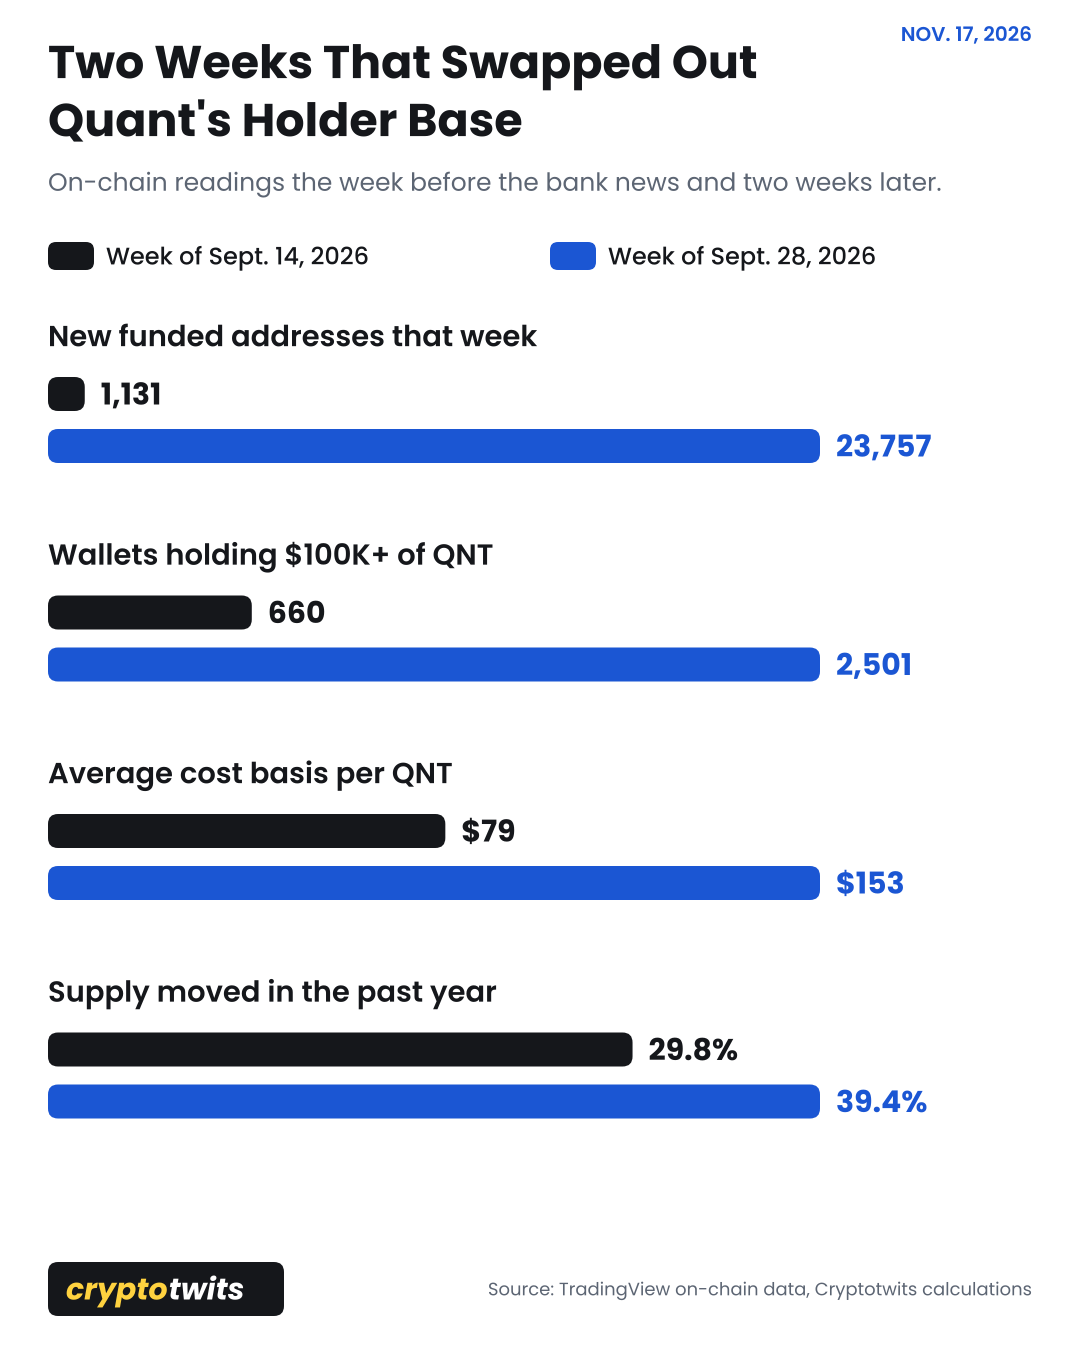
That last one is the problem. A big slice of holders paid $200 and up, and price is already 3.5% under the new cost basis. That took seven weeks this time and 19 after the 2021 spike.
Bottom Or More To Go?
History is a sample of one, and it isn't kind. After the 2021 blow-off, QNT took 40 weeks to bottom at $41.63, down 90% and about 50% under cost basis. Today it's eight weeks in and 3.5% under.
A 2022-sized discount lands around $75 to $80. If that cycle rhymes, bulls would likely look for long opportunities there, with the scorecard back in the 4s. That's also where QNT traded last winter, nearly a full round trip.
The difference this time is 25 banks. The on-chain data doesn't grade reasons. ✅
Get In Touch 📬
Email me, Jonathan Morgan, feedback; I’d love to hear from you. 📧
Follow me on Stocktwits 🫂 And Sponsor this newsletter 😎
|
Get the app Real-time alerts, live earnings calls, your personalised feed - the best experience is on mobile.
|


Terms & Conditions 📝
Securities Disclaimer: STOCKTWITS IS NOT A TAX ADVISOR, BROKER, FINANCIAL ADVISOR OR INVESTMENT ADVISOR. THE SERVICE IS NOT INTENDED TO PROVIDE TAX, LEGAL, FINANCIAL OR INVESTMENT ADVICE, AND NOTHING ON THE SERVICE SHOULD BE CONSTRUED AS AN OFFER TO SELL, A SOLICITATION OF AN OFFER TO BUY, OR A RECOMMENDATION FOR ANY SECURITY. Trading in such securities can result in immediate and substantial losses of the capital invested. You should only invest risk capital, and not capital required for other purposes. You alone are solely responsible for determining whether any investment, security or strategy, or any other product or service, is appropriate or suitable for you based on your investment objectives and personal and financial situation. You should also consult an attorney or tax professional regarding your specific legal or tax situation. The Content is to be used for informational and entertainment purposes only and the Service does not provide investment advice for any individual. Stocktwits, its affiliates and partners specifically disclaim any and all liability or loss arising out of any action taken in reliance on Content, including but not limited to market value or other loss on the sale or purchase of any company, property, product, service, security, instrument, or any other matter. You understand that an investment in any security is subject to a number of risks, and that discussions of any security published on the Service will not contain a list or description of relevant risk factors. In addition, please note that some of the stocks about which Content is published on the Service have a low market capitalization and/or insufficient public float. Such stocks are subject to more risk than stocks of larger companies, including greater volatility, lower liquidity and less publicly available information. Read the full terms & conditions here. 🔍
Author Disclosure: The author of this newsletter holds positions in AVAX, ADA, PUDGY, WLD, NEAR, INJ, LTC, LINK, ZEC, XLM, and FET. 📋