OVERVIEW
Altcoins Are Up 56% And It Still Feels Like A Vikings Playoff Game 🏈
Here’s What’s Happening 👇
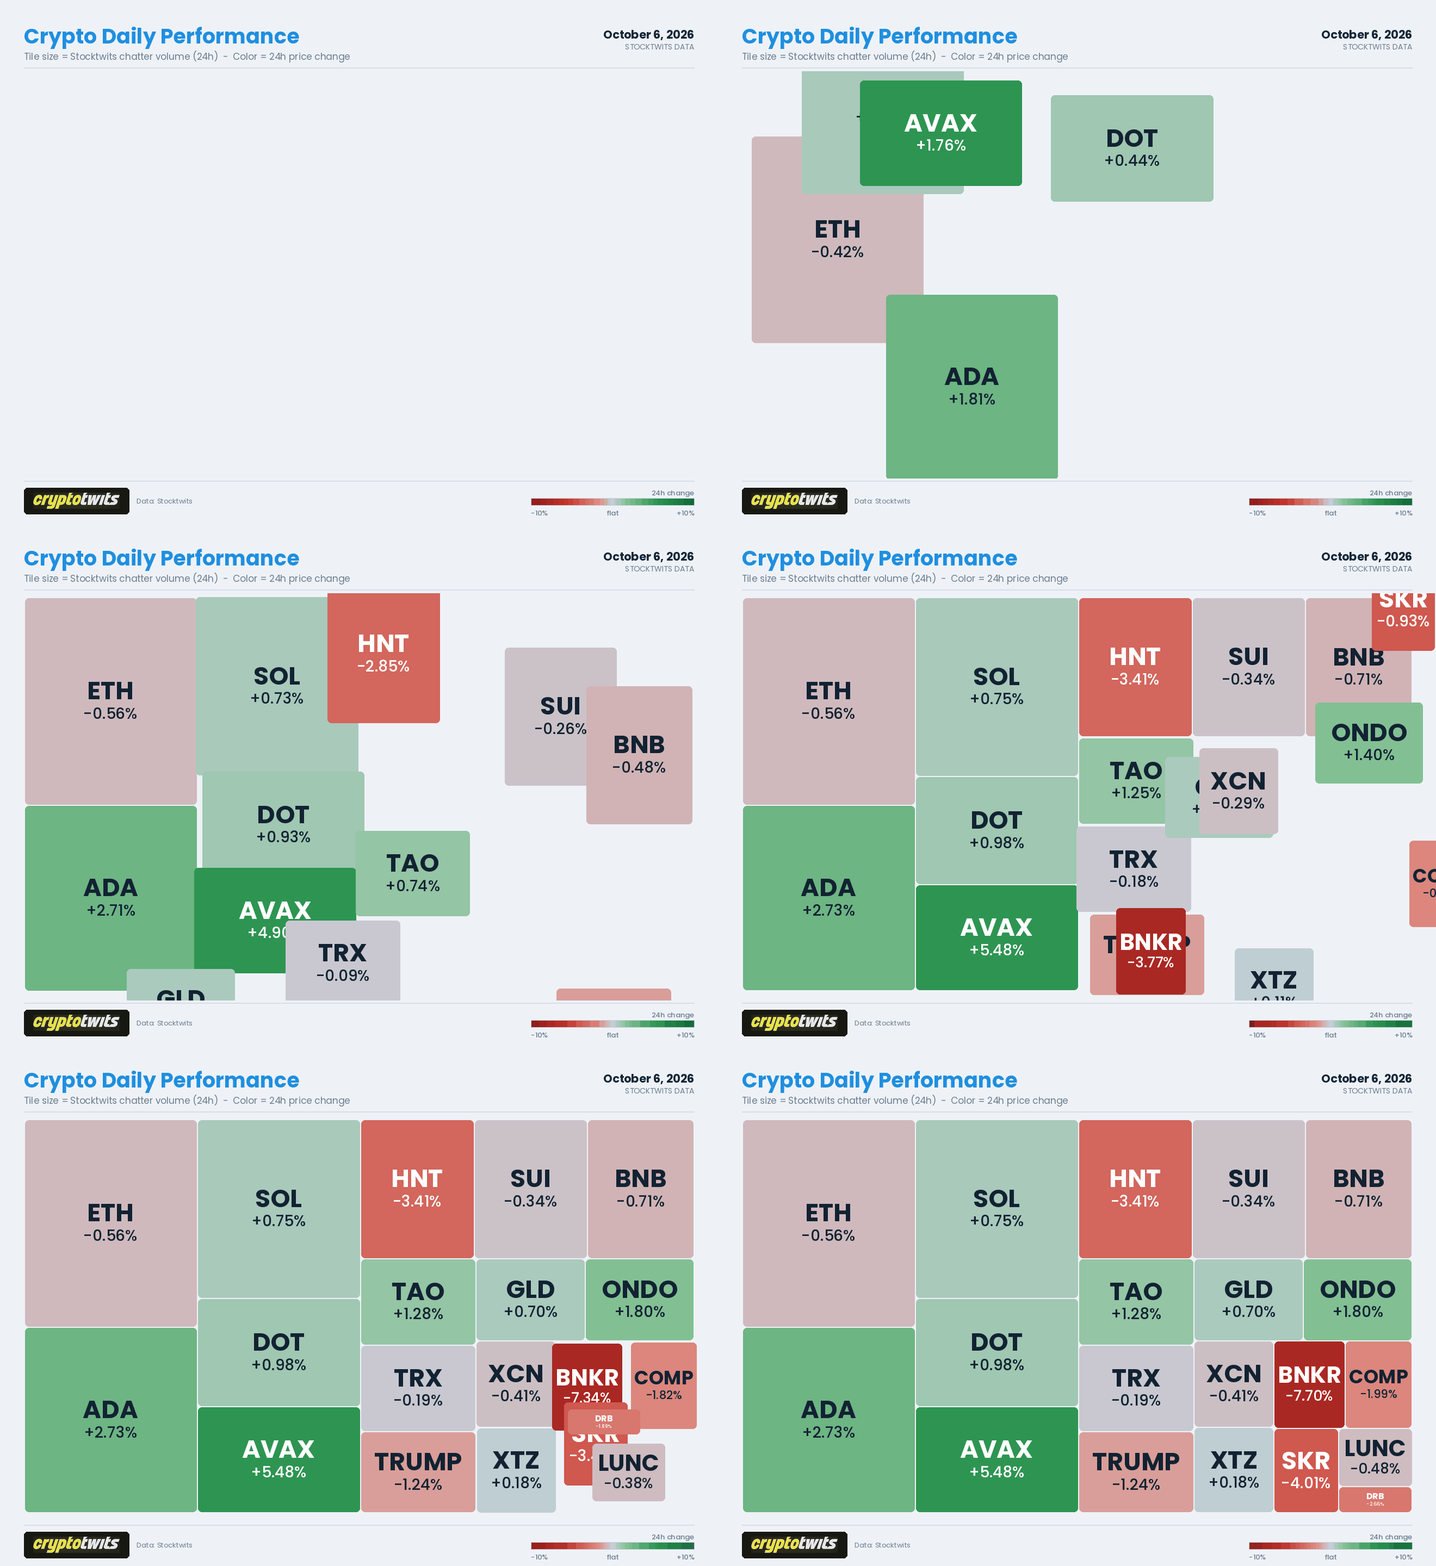
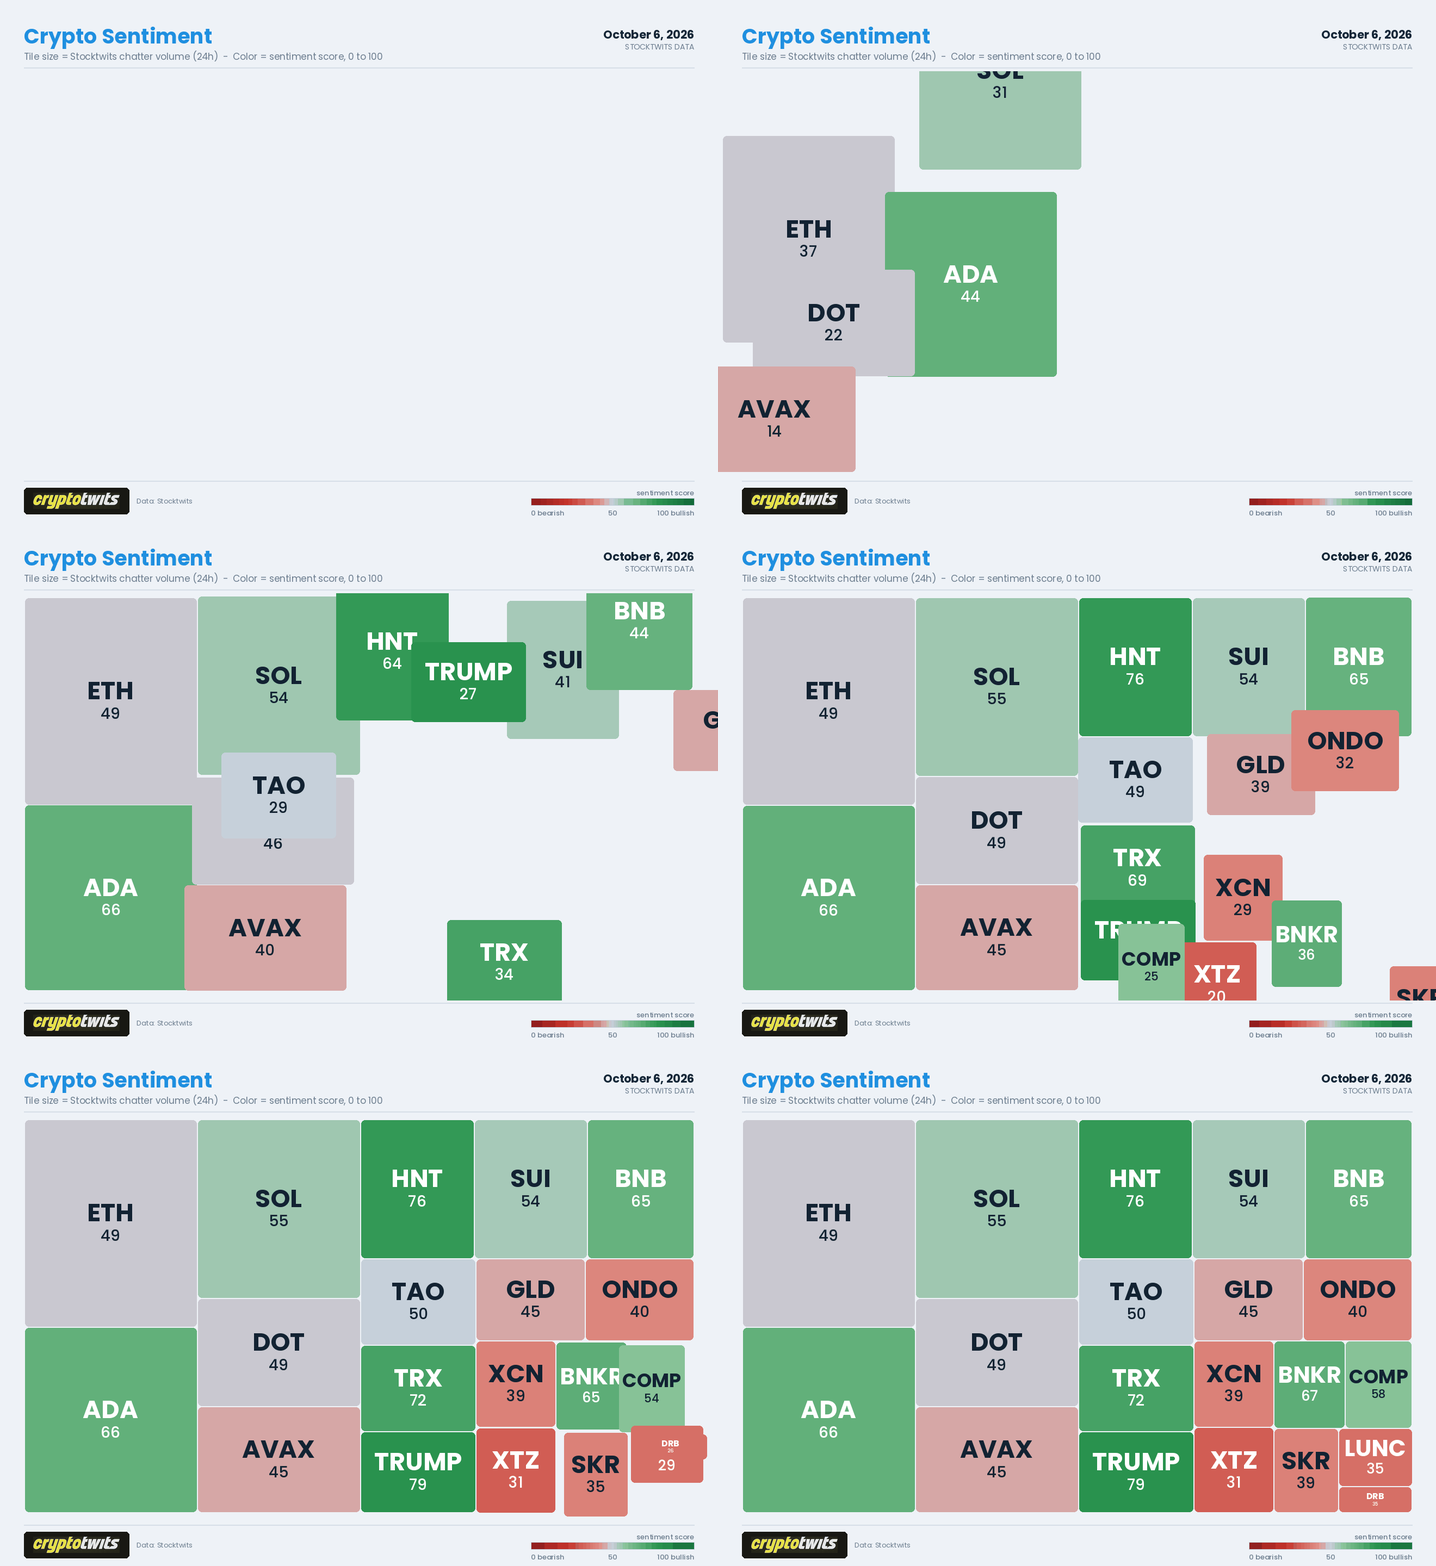
ALTCOINS
Up 56% And Nobody’s Happy 🏈
The altcoin market cap - TOTAL3ES, which is everything that isn’t Bitcoin, Ethereum, or a stablecoin - has gone from $355 billion on June 25 to $556 billion. Up 56% in 103 days. $AAVE ( ▼ 2.23% ) has doubled. $UNI ( ▼ 6.63% ) has tripled.
And few if anybody seems really happy about it. 😐
Ask a Vikings fan how that works. It’s the 14-3 season. Everything’s clicking, Skol, Skol, Skol, somebody is pricing flights and hopes that This Is Is The Year. Then the conversation hits a lull and there’s that thing in your stomach, the one that knows how this goes. Gary Anderson doesn’t miss a kick all year in 1998 and then misses the one. The Minneapolis Miracle buys you seven days before Philadelphia hangs 38 on you.
Four Super Bowls, zero wins. The good feeling still shows up. It just brings a chaperone.
So is the dread earned, or is this just scar tissue talking? I took a look at the charts and the numbers. It’s some of both. 🤷
ALTCOINS
How Bad Was The Drop? Pretty God Damned Bad. 📉
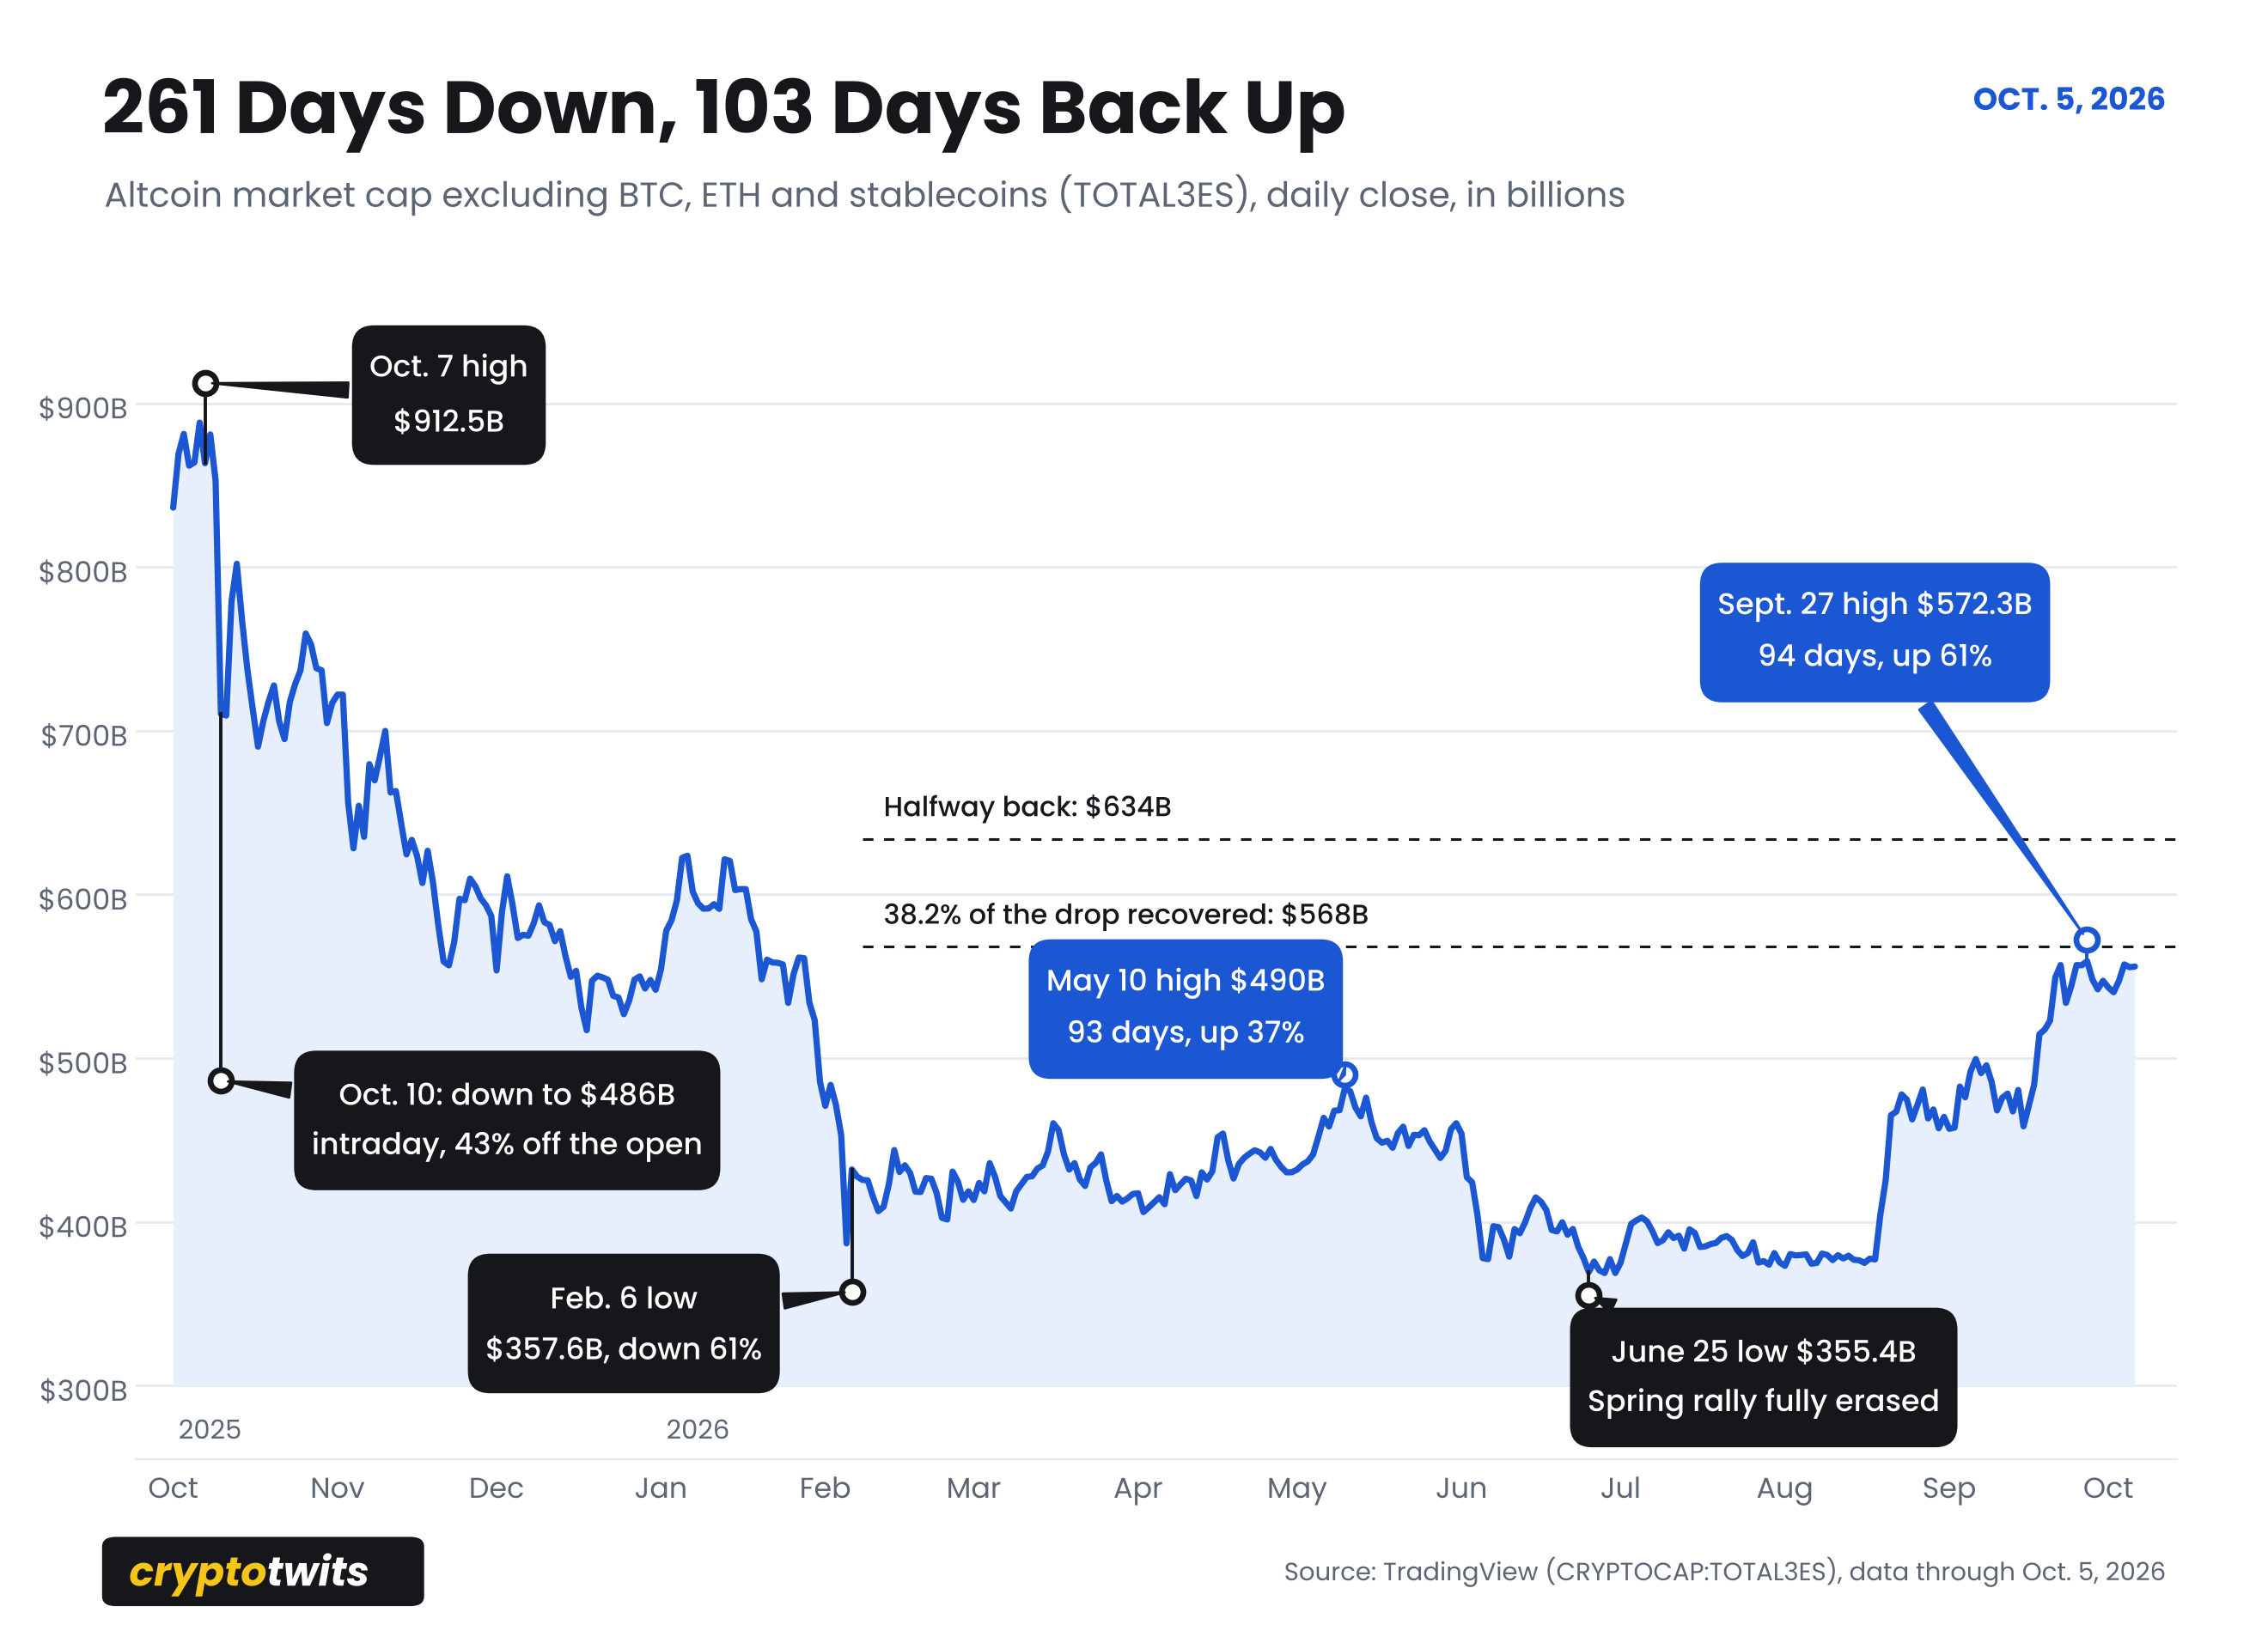
Start at the top. On Oct. 7, 2025, the altcoin market cap peaked at $912.5 billion. Three days later came F*cktober the 10th candle: opened at $851 billion, traded down to $486 billion, closed at $710 billion. For a few hours, 43% of the entire altcoin market was just gone. Thanos only got half, and he needed all six stones.
It kept going. By Feb. 6, 2026, the index was at $357.6 billion. Down 61% in 122 days.
Then came the part of the bear market that people subconsciously forget because it’s slow and mean instead of fast and loud. Alts rallied 37% off that February low into a May 10 high near $490 billion. It took 93 days. Hope was had. Threads were written. Then the first week of June took 17% in four days, and by June 25 the whole rally was erased, with a new low at $355.4 billion thrown in. It undercut February by about $2 billion. Just enough to clean out anybody with a stop under the old low.
Top to bottom: 61% gone over 261 days. 💀
Click to enlarge.
ALTCOINS
How Much Has Come Back? 🔄
The first 54 days after the low were nothing. From late June through Aug. 18 the index sat in a box between roughly $370 billion and $400 billion and did its best impression of a screensaver. So… pretty much what happens to every football fan that didn’t have their team win the Super Bowl. 📆
Then Aug. 19 happened. In four days alts ran from $377 billion to a high just under $510 billion. A month of chop above $450 billion followed, then another leg in mid-September, and a high of $572.3 billion on Sept. 27.
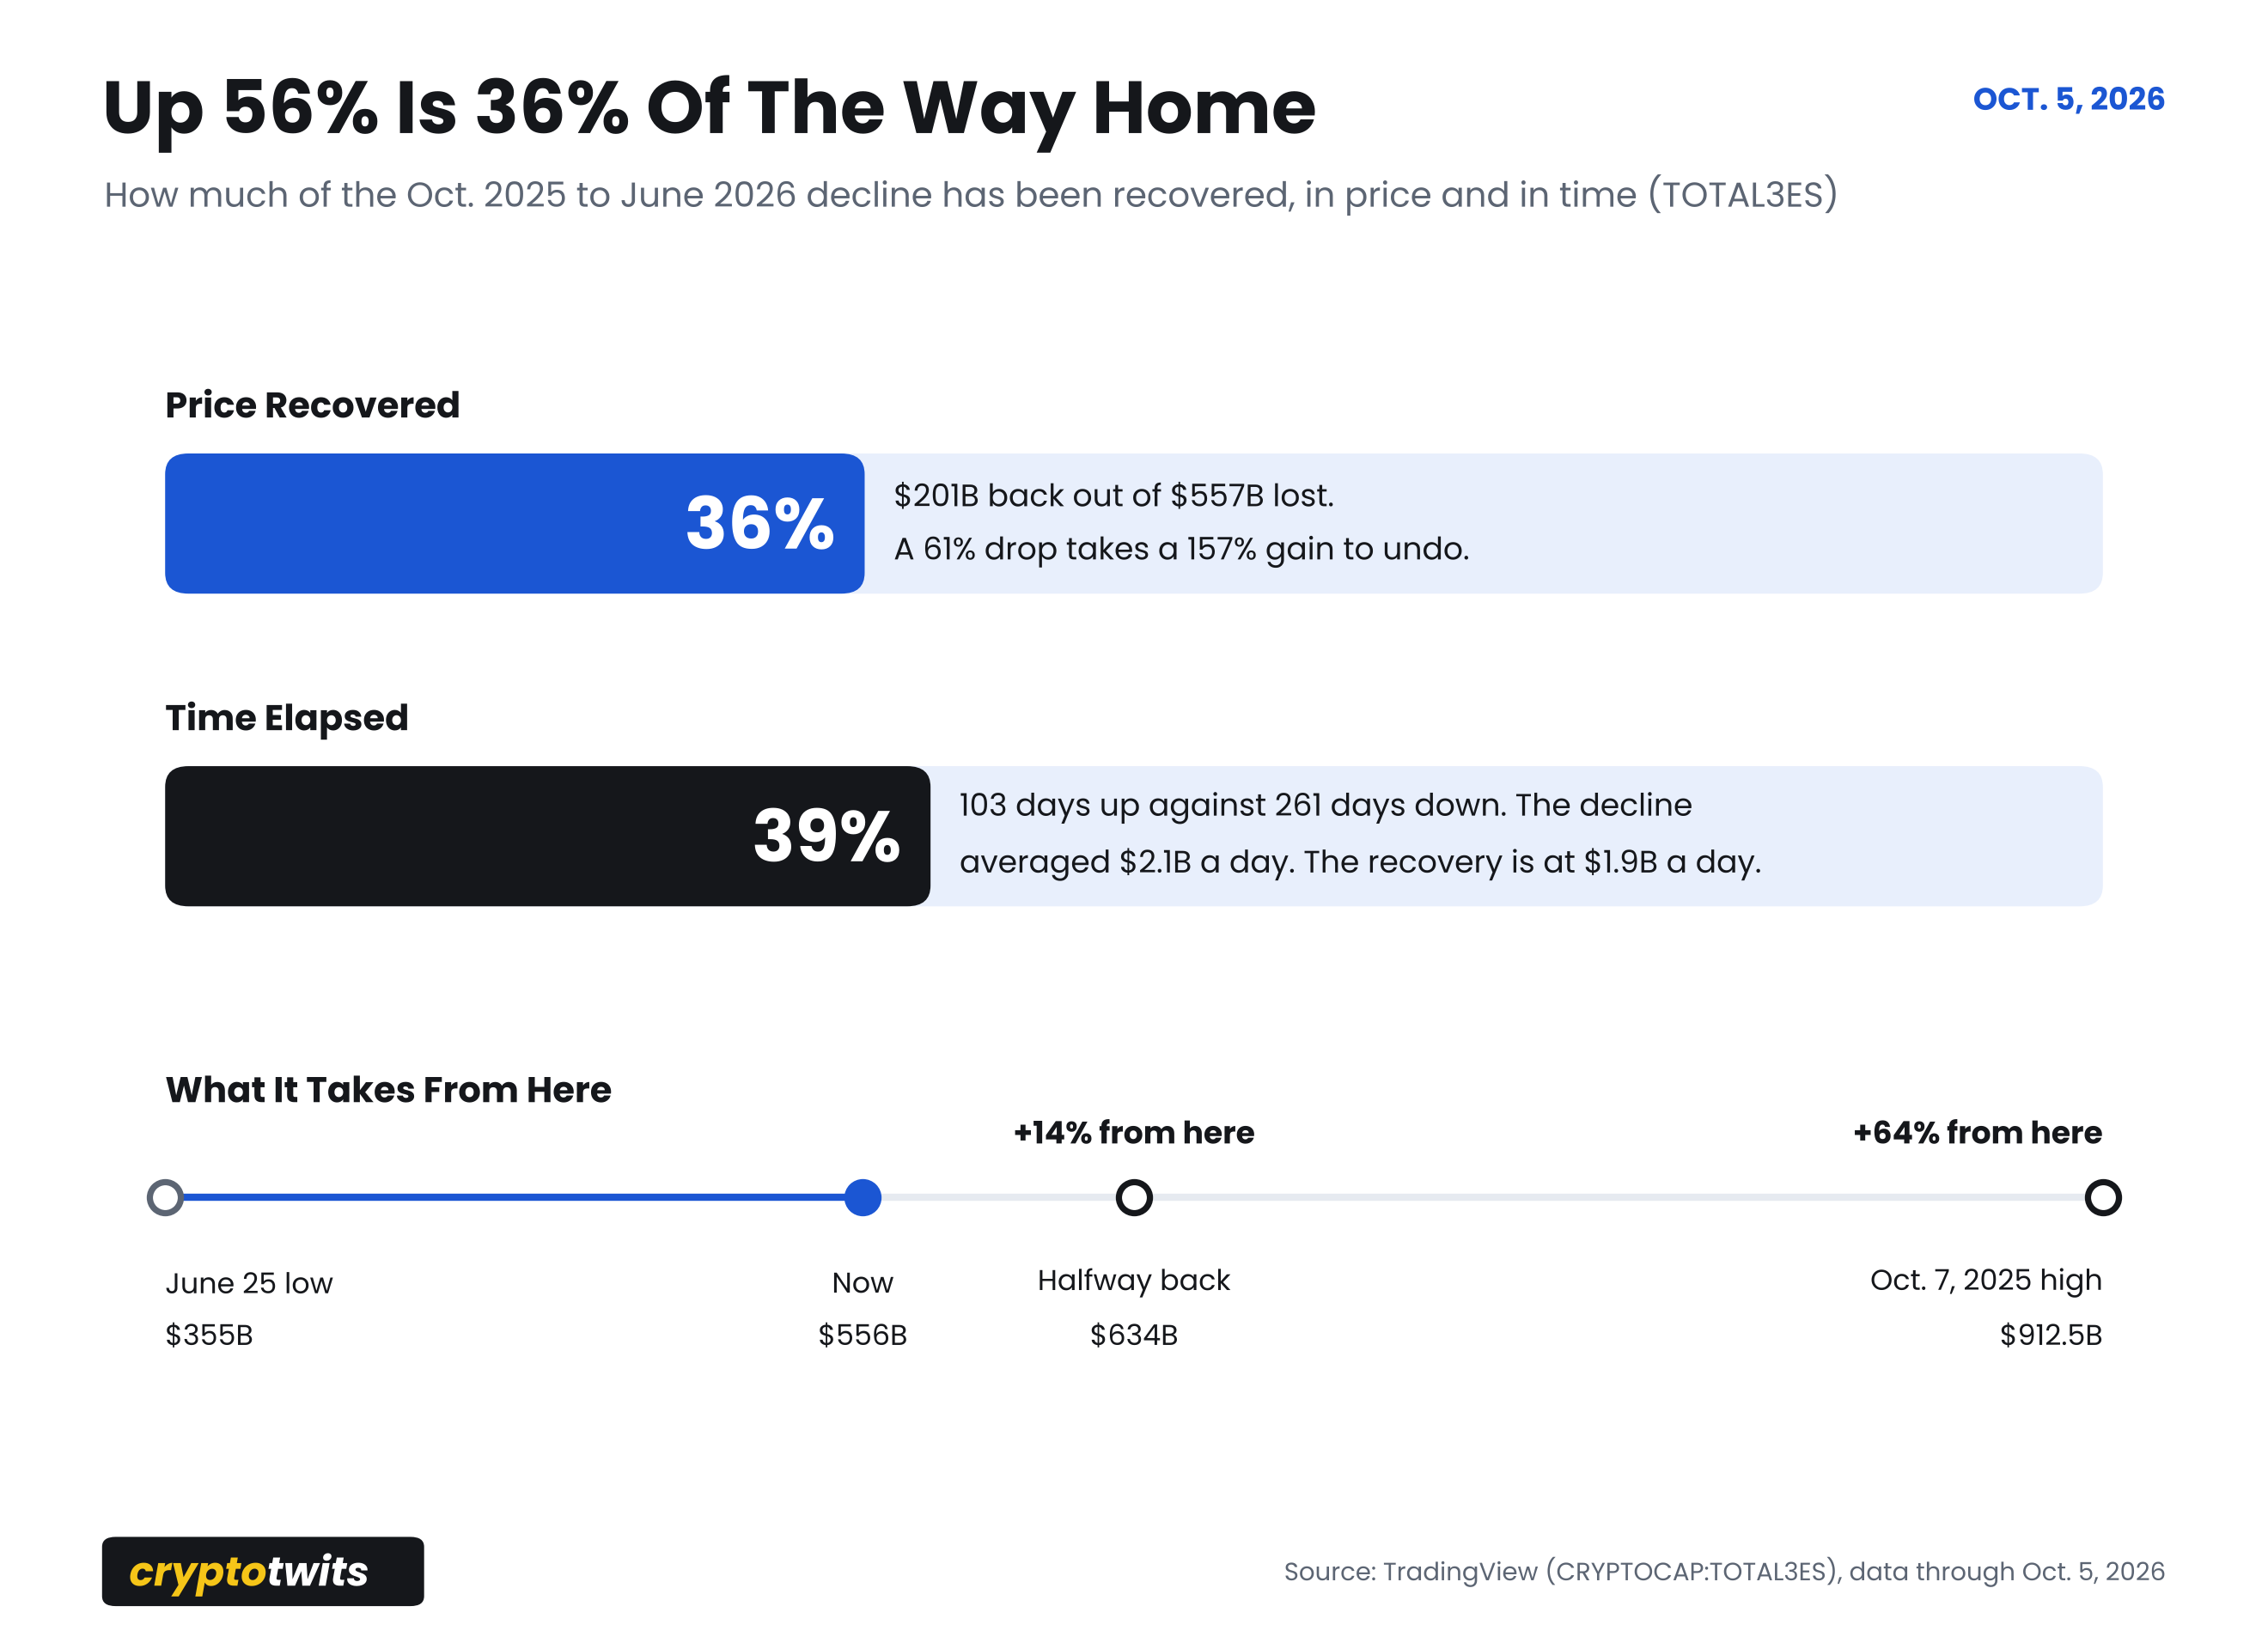
So where does that leave things? $201 billion recovered out of $557 billion lost. A little over a third. The index is still 39% below the October 2025 high and needs another 64% from here to see it again.
That’s the math nobody’s brain does on its own. A 61% drop takes a 157% gain to undo. “Up 56%” sounds like most of the way home. It’s 36% of the way home. 🏠
Click to enlarge.
ALTCOINS
Is The Recovery Too Slow? ⏱️
Depends which stopwatch you’re holding. There are three, and they don’t agree. ⌚
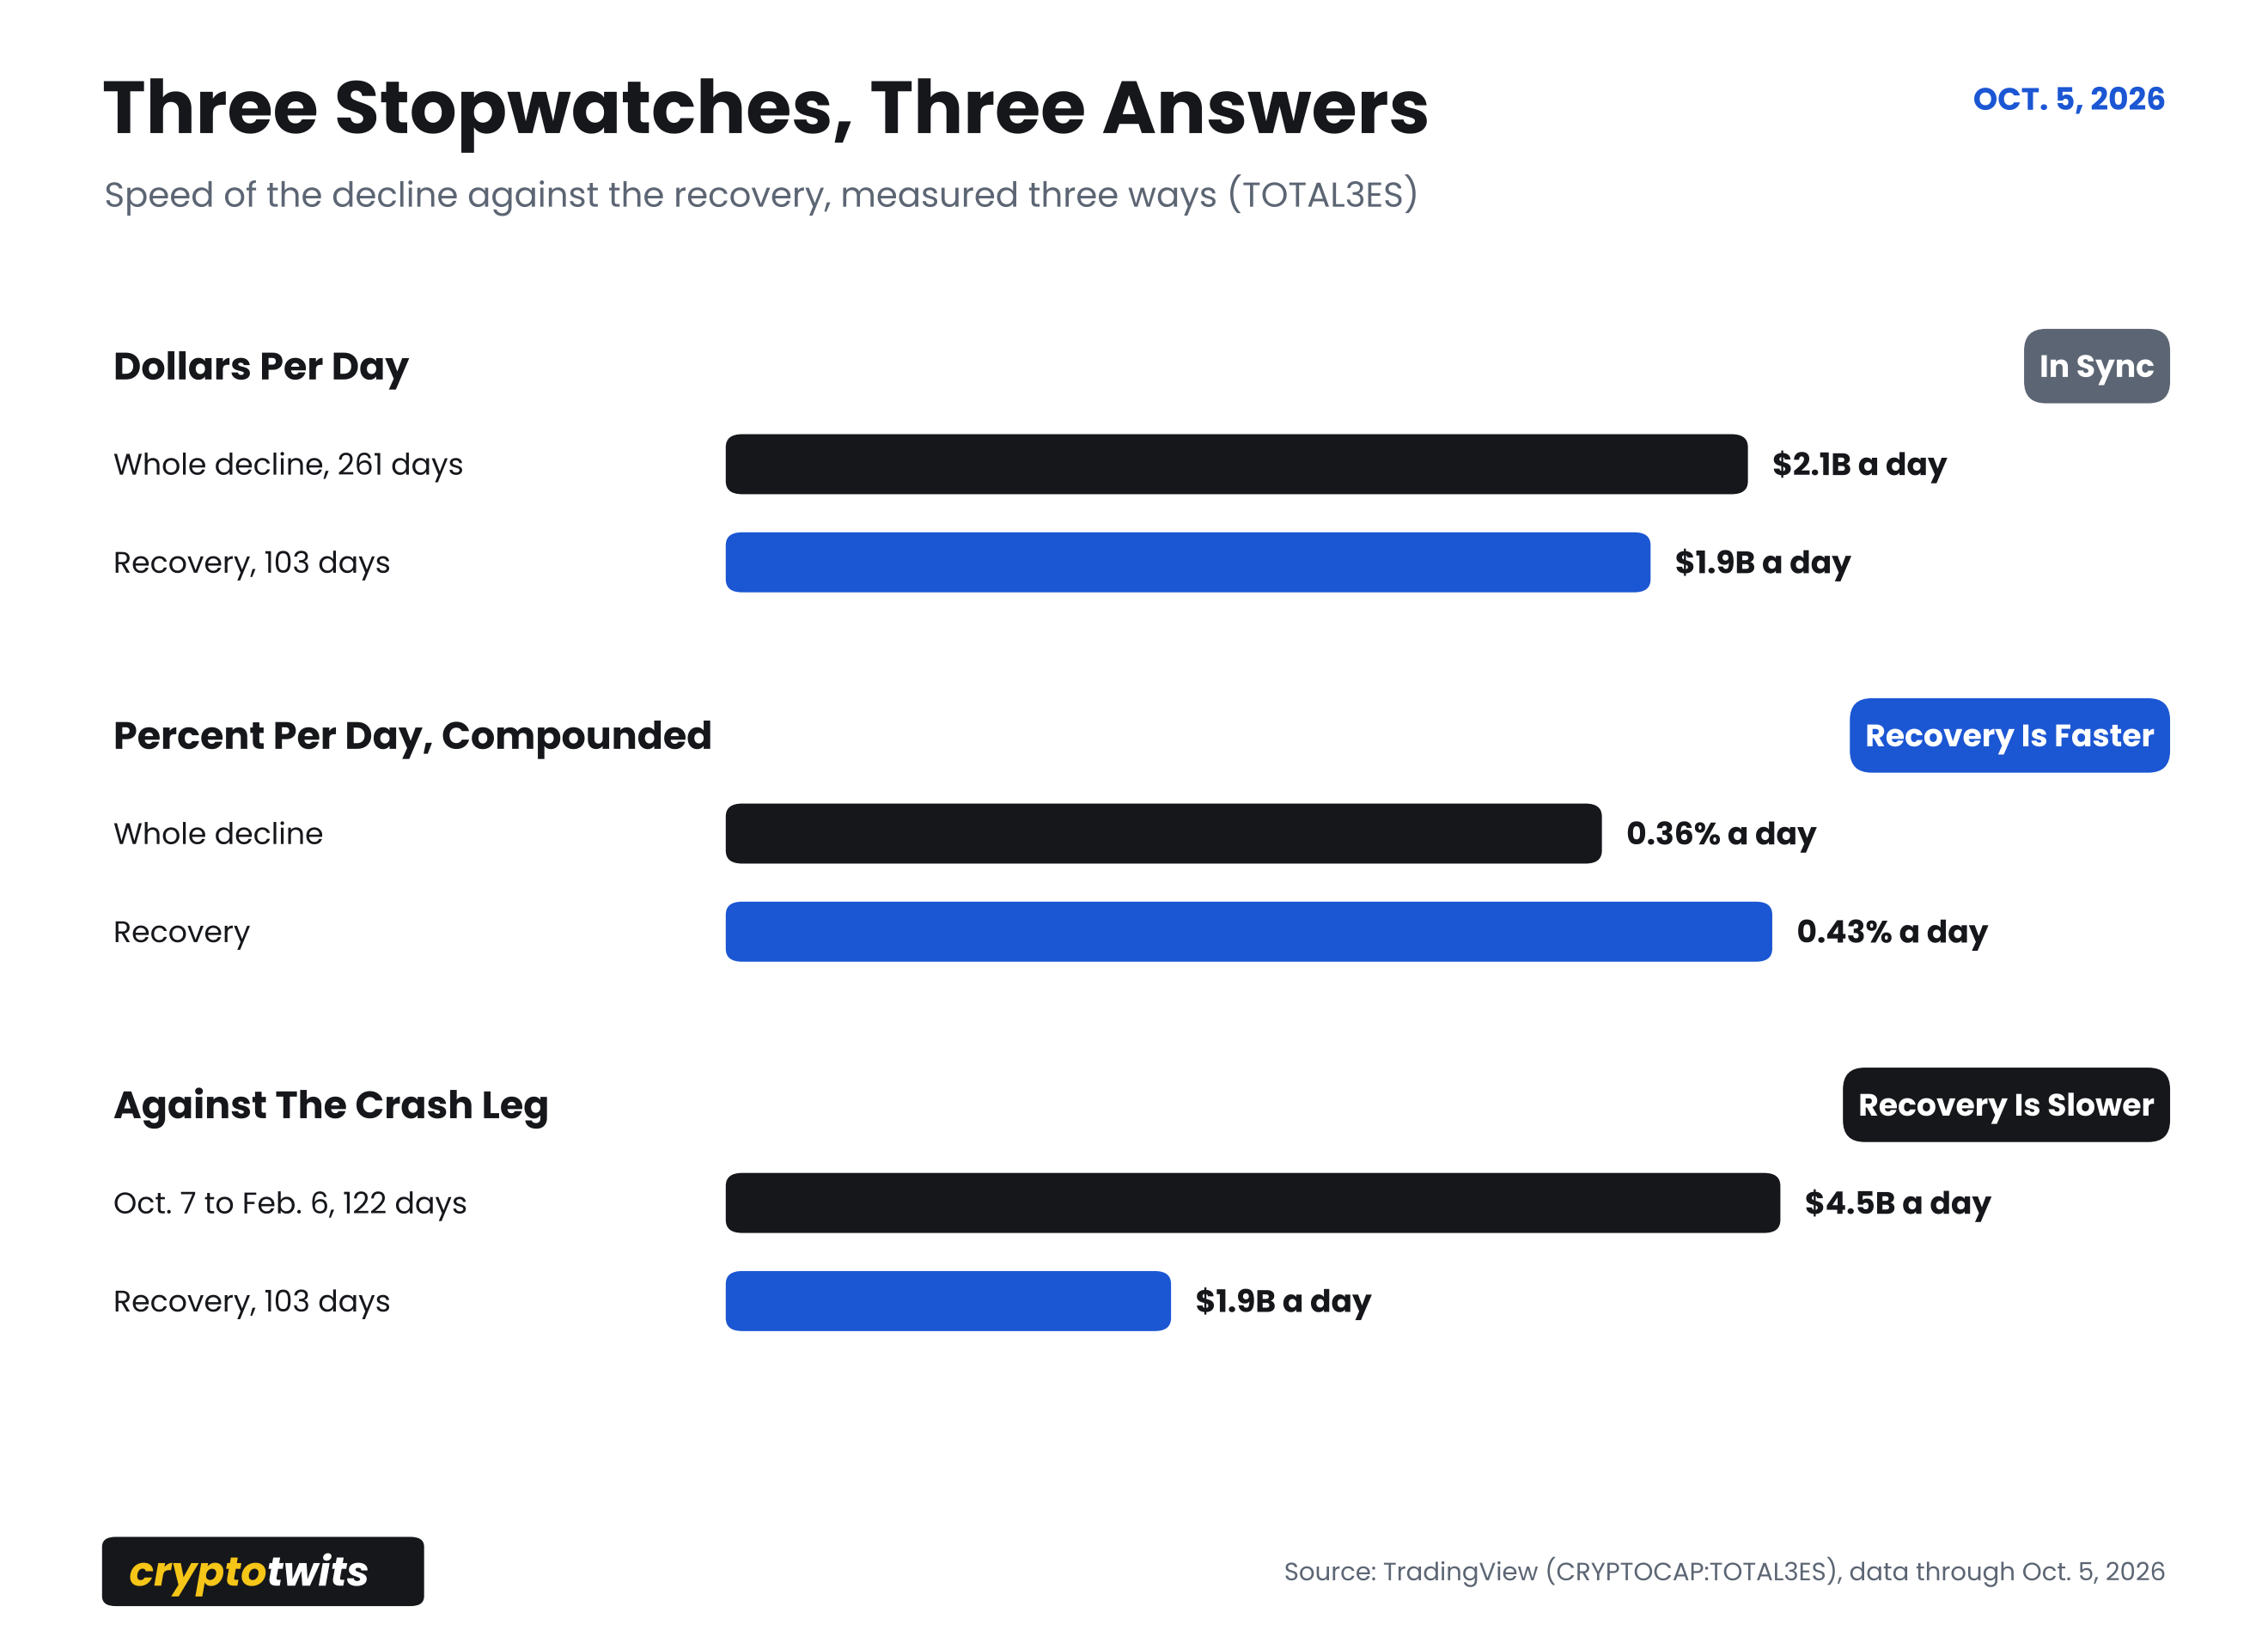
In dollars, it’s in sync. The decline took 261 days to erase $557 billion. About $2.1 billion a day. The recovery has put back $201 billion in 103 days, or about $1.9 billion a day. Run it as time against price and it gets tighter: 39% of the time elapsed, 36% of the price recovered. A recovery walking back up at the exact pace the decline walked down would have the index near $575 billion today. The Sept. 27 high was $572 billion.
If you’re the type who squares time and price (oh hai!), that’s about as balanced as a chart gets. The high also stalled right on the 38.2% retracement of the whole drop, at $568 billion, because of course it did. 📐
Click to enlarge.
In percent, it’s ahead. Compounded, alts lost about 0.36% a day on the way down and are making about 0.43% a day on the way back. Line the two up by day count: 103 days into the decline, the index was down 36%. 103 days into the recovery, it’s up 56%. Smaller pile, so fewer dollars. Still ahead.
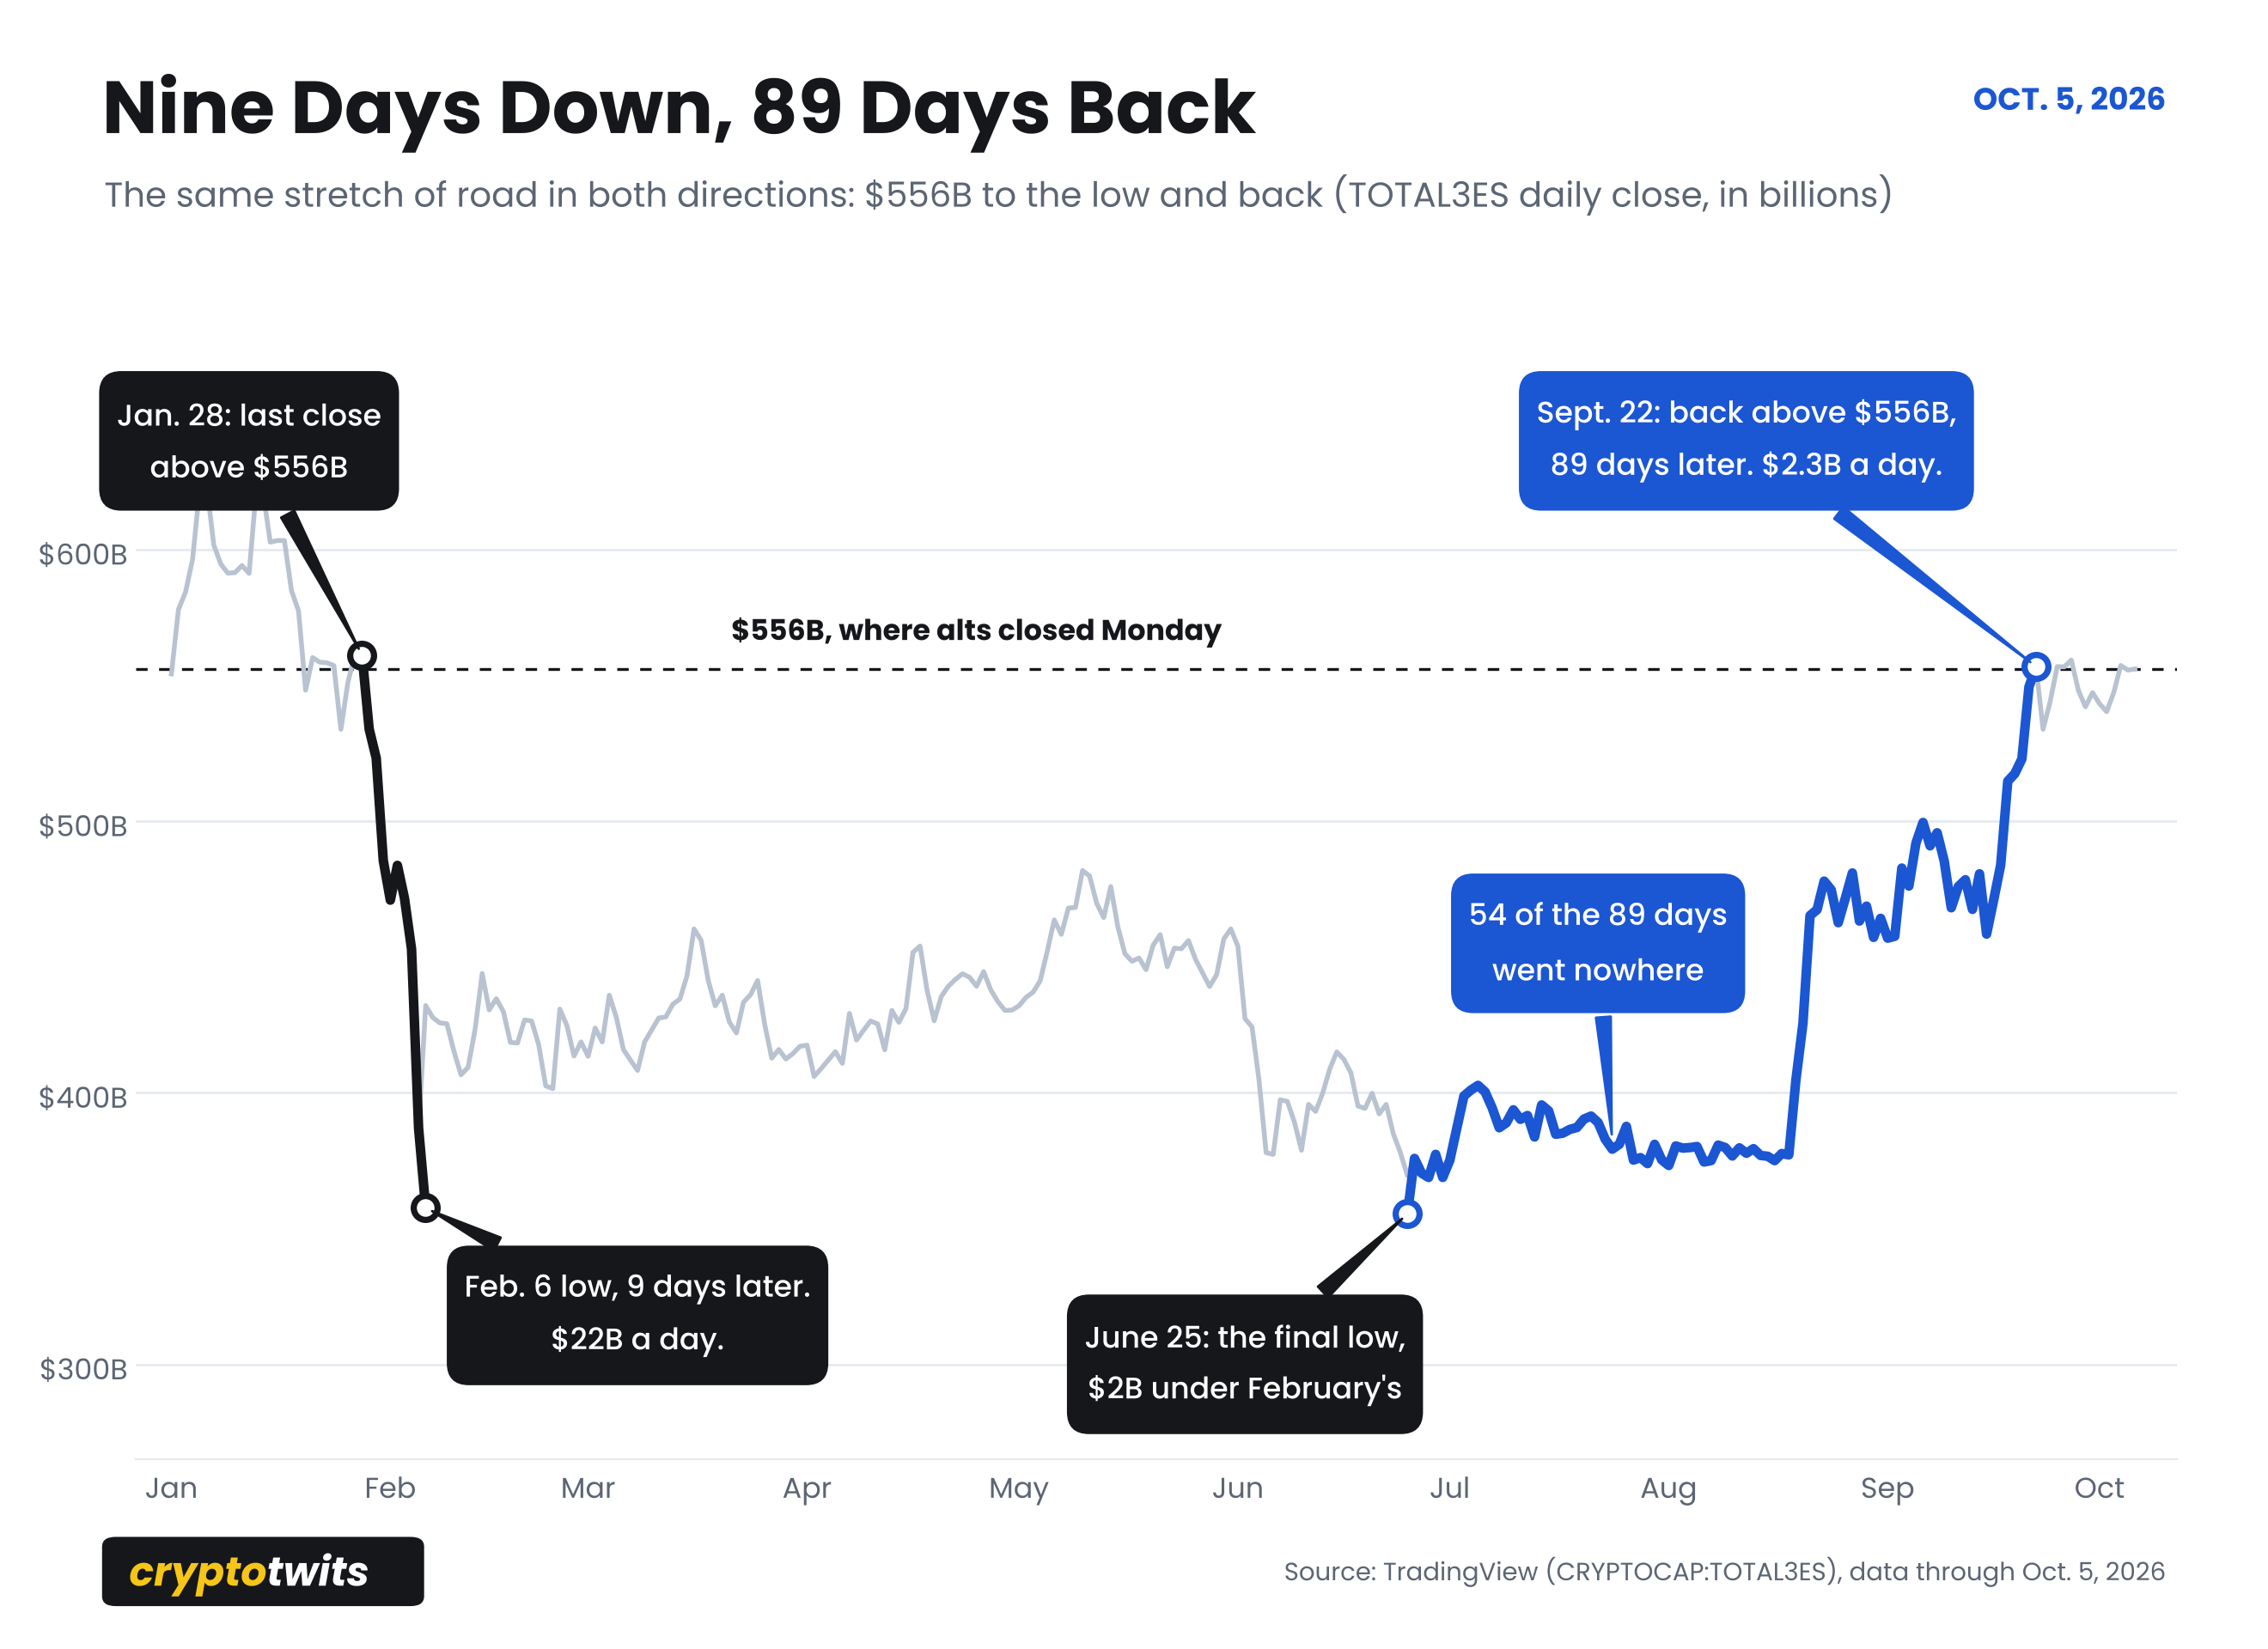
Against the broader ugly bits, it’s a crawl. Nobody’s memory of the drop is a 261-day average. It’s the crash. That first leg, Oct. 7 to Feb. 6, ran $4.5 billion a day for 122 days, and the recovery is moving at less than half that. And how lopsided does it get up close? Alts last closed above $556 billion on Jan. 28. Nine days later they were at the low. Getting back to $556 billion took 89 days. The drop got the eagles. The recovery is walking to Mordor. 🦅
Click to enlarge.
Aaaand the walk wasn’t steady. 54 days of nothing, then most of the gains in two windows that each lasted under a week. The best seven days of the recovery produced half of the whole thing. The drop did its work in bursts too - Oct. 10, then the last week of January into Feb. 5, when nearly a third of the market cap vanished in eight days - but even its worst week was only about a quarter of the damage.
The one thing the recovery has going for it is manners. 59 up days against 44 down, and the biggest one-day drop so far is 4.6%. The decline had a 16.7% day.
Miss those two windows and the index’s 56% isn’t your 56%. 🎯
ALTCOINS
Why It Feels Like January In Minneapolis 🥶
The food at this wedding is great. You’ve also just noticed the band is wearing chainmail. And playing a suspiciously not happy or hopeful song. 🎻
A few things are stacked on top of each other here.
Losses weigh more. Doctors Kahneman and Tversky put a number on it decades ago: a loss lands about twice as hard as a gain of the same size. Now run that on a market where the loss was 61% and the gain is 56% of a much smaller pile. The ledger in people’s heads isn’t close to even, and the ledger in their accounts isn’t either.
Everybody upstairs wants out. From mid-November 2024 into January 2026, about 14 months, the altcoin market cap spent nearly every day above where it sits right now. Anyone who bought in that stretch and still holds is underwater on the index. Behavioral finance calls what they do next the disposition effect. Hersh Shefrin’s (the economist, not the doctor) name for it is better: get-evenitis. Those hodlers want out at their number so they can stop thinking about it, and every one else higher walks into a fresh batch of them. Rallies in that spot feel heavy because they are heavy. 🏋️
Click to enlarge.
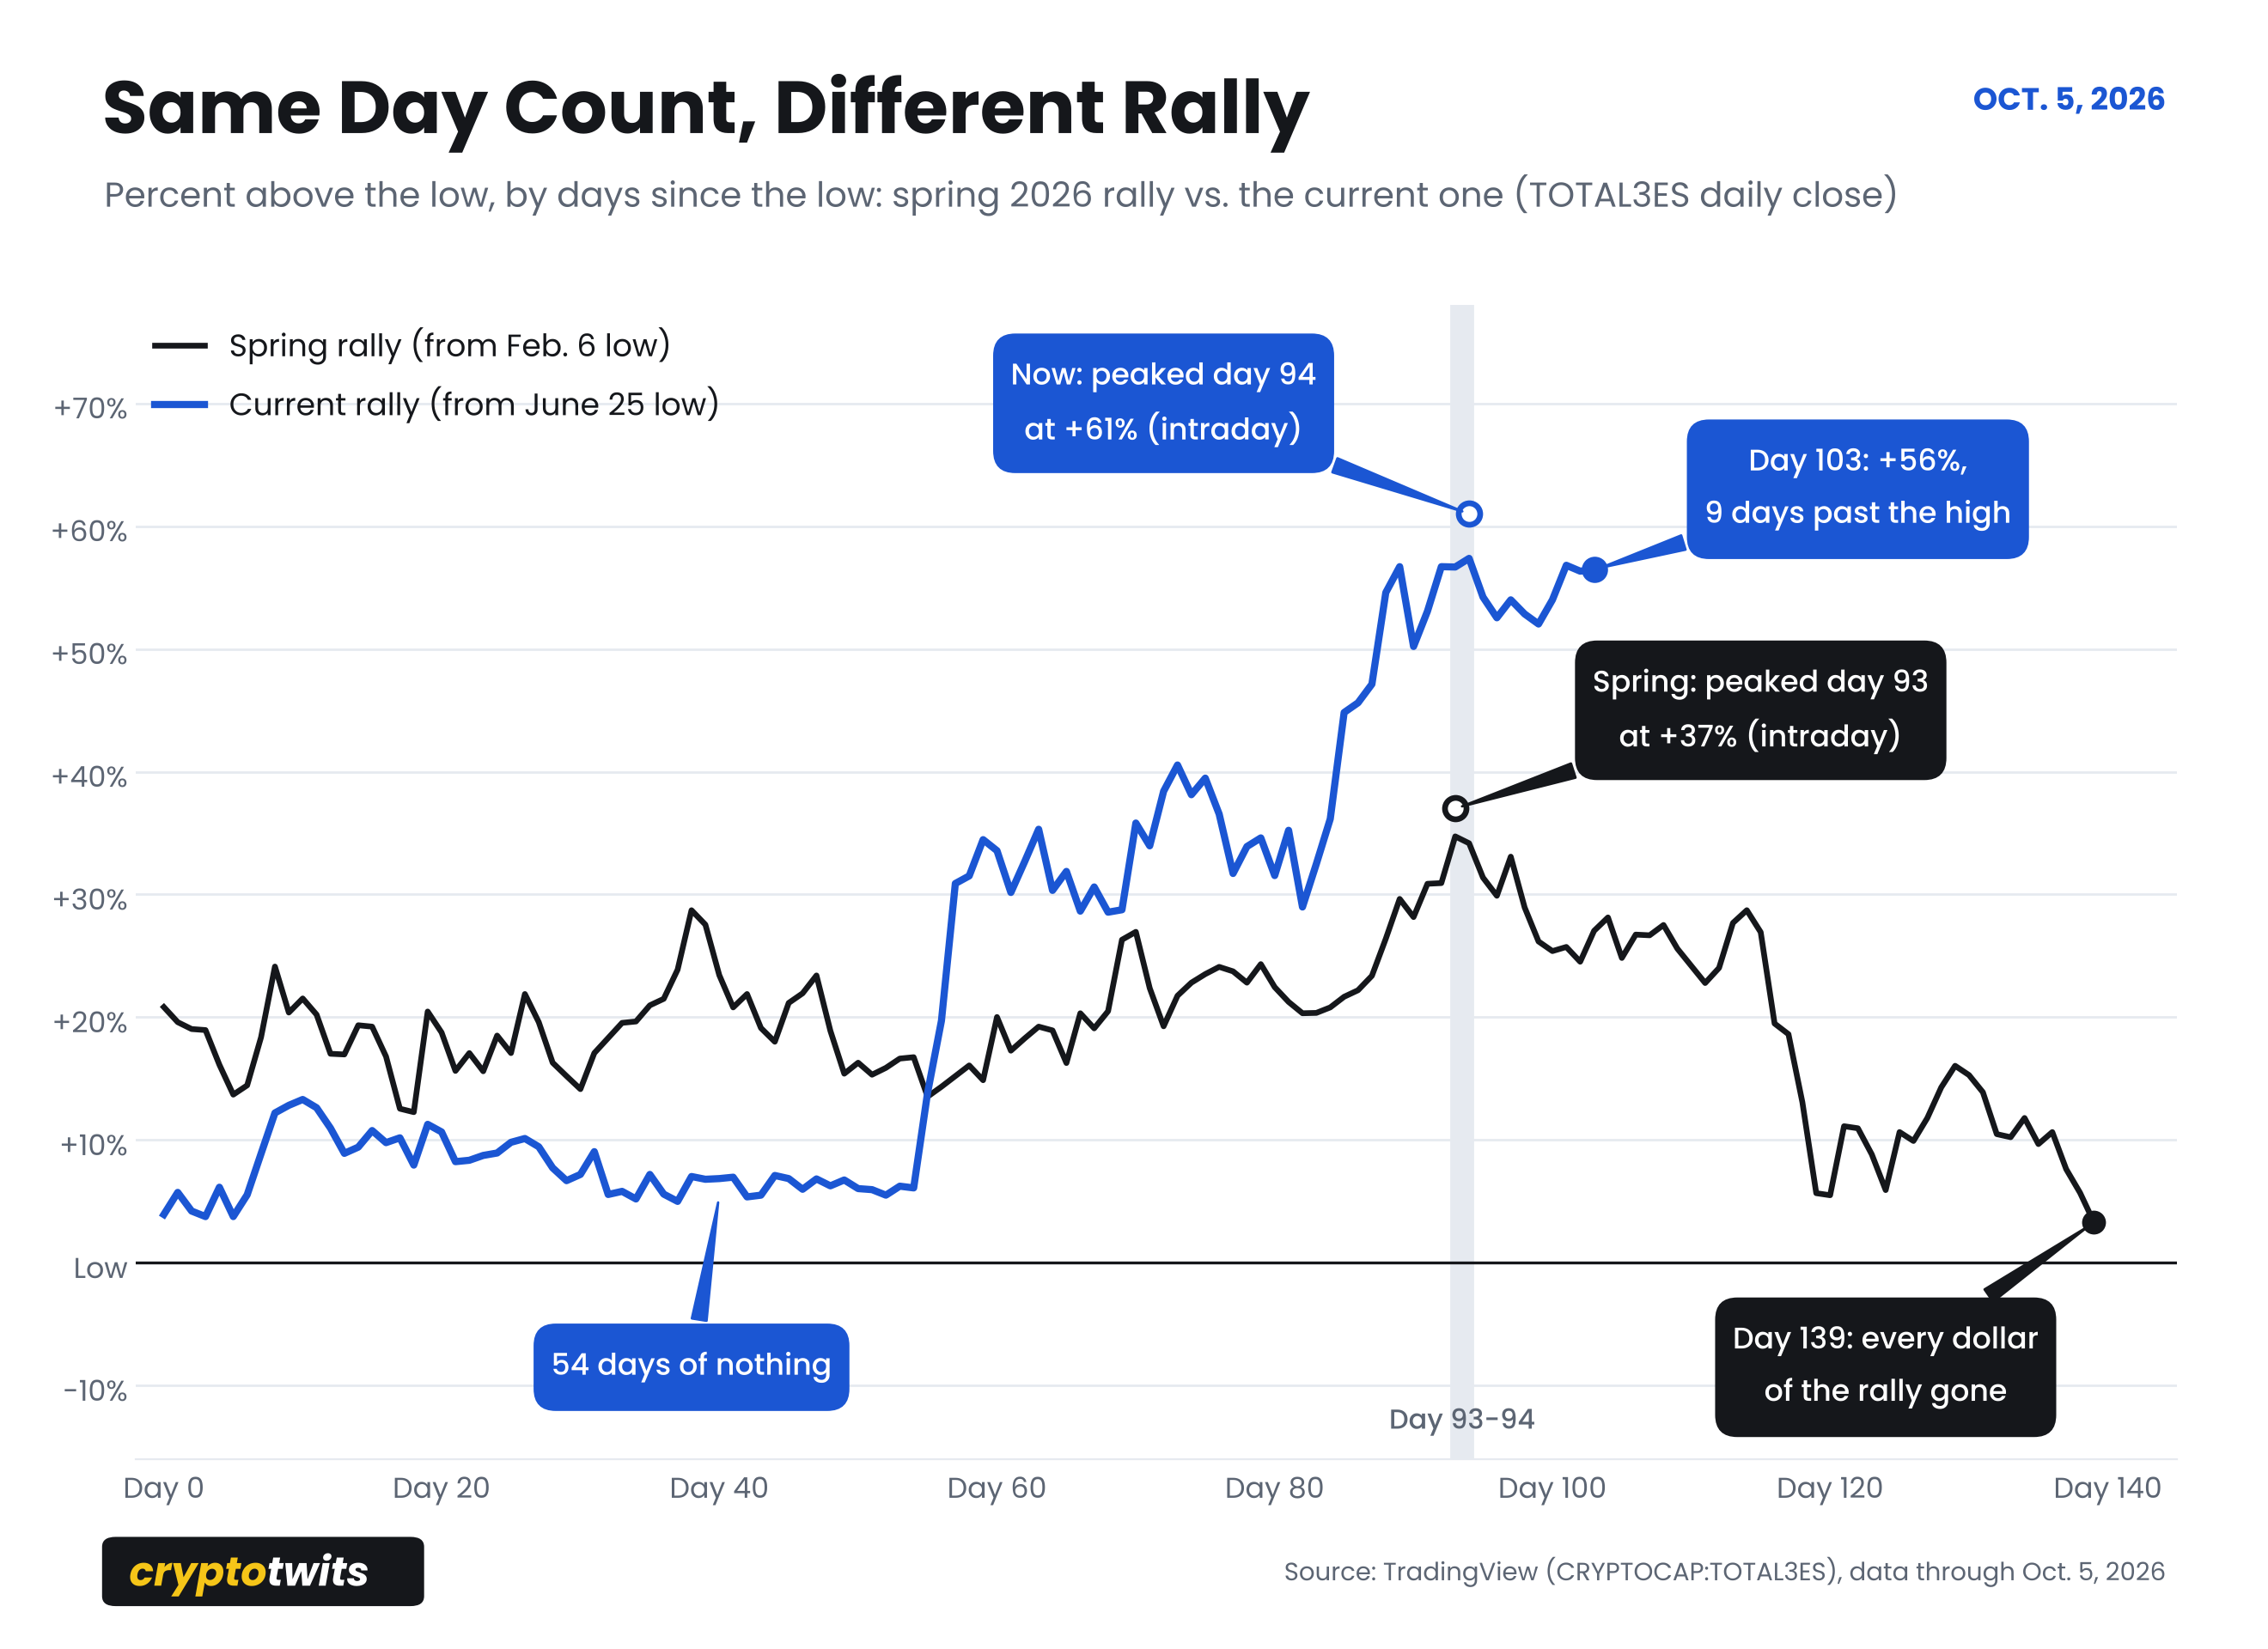
They, me, you, we’ve seen this drive before. February to May: 93 days, up 37%, erased in 46. June to the Sept. 27 high: 94 days. It’s up 61% this time and it’s been more than a week without a new high. All this has happened before, and, well.
Click to enlarge.
Nobody trusts their own read anymore. Psychologists call the end state learned helplessness. Get zapped enough times no matter which lever you pull and you stop believing the levers do anything. The January pop failed. The spring rally failed after three months of looking real. After that, a green week reads as a setup for heart ache.
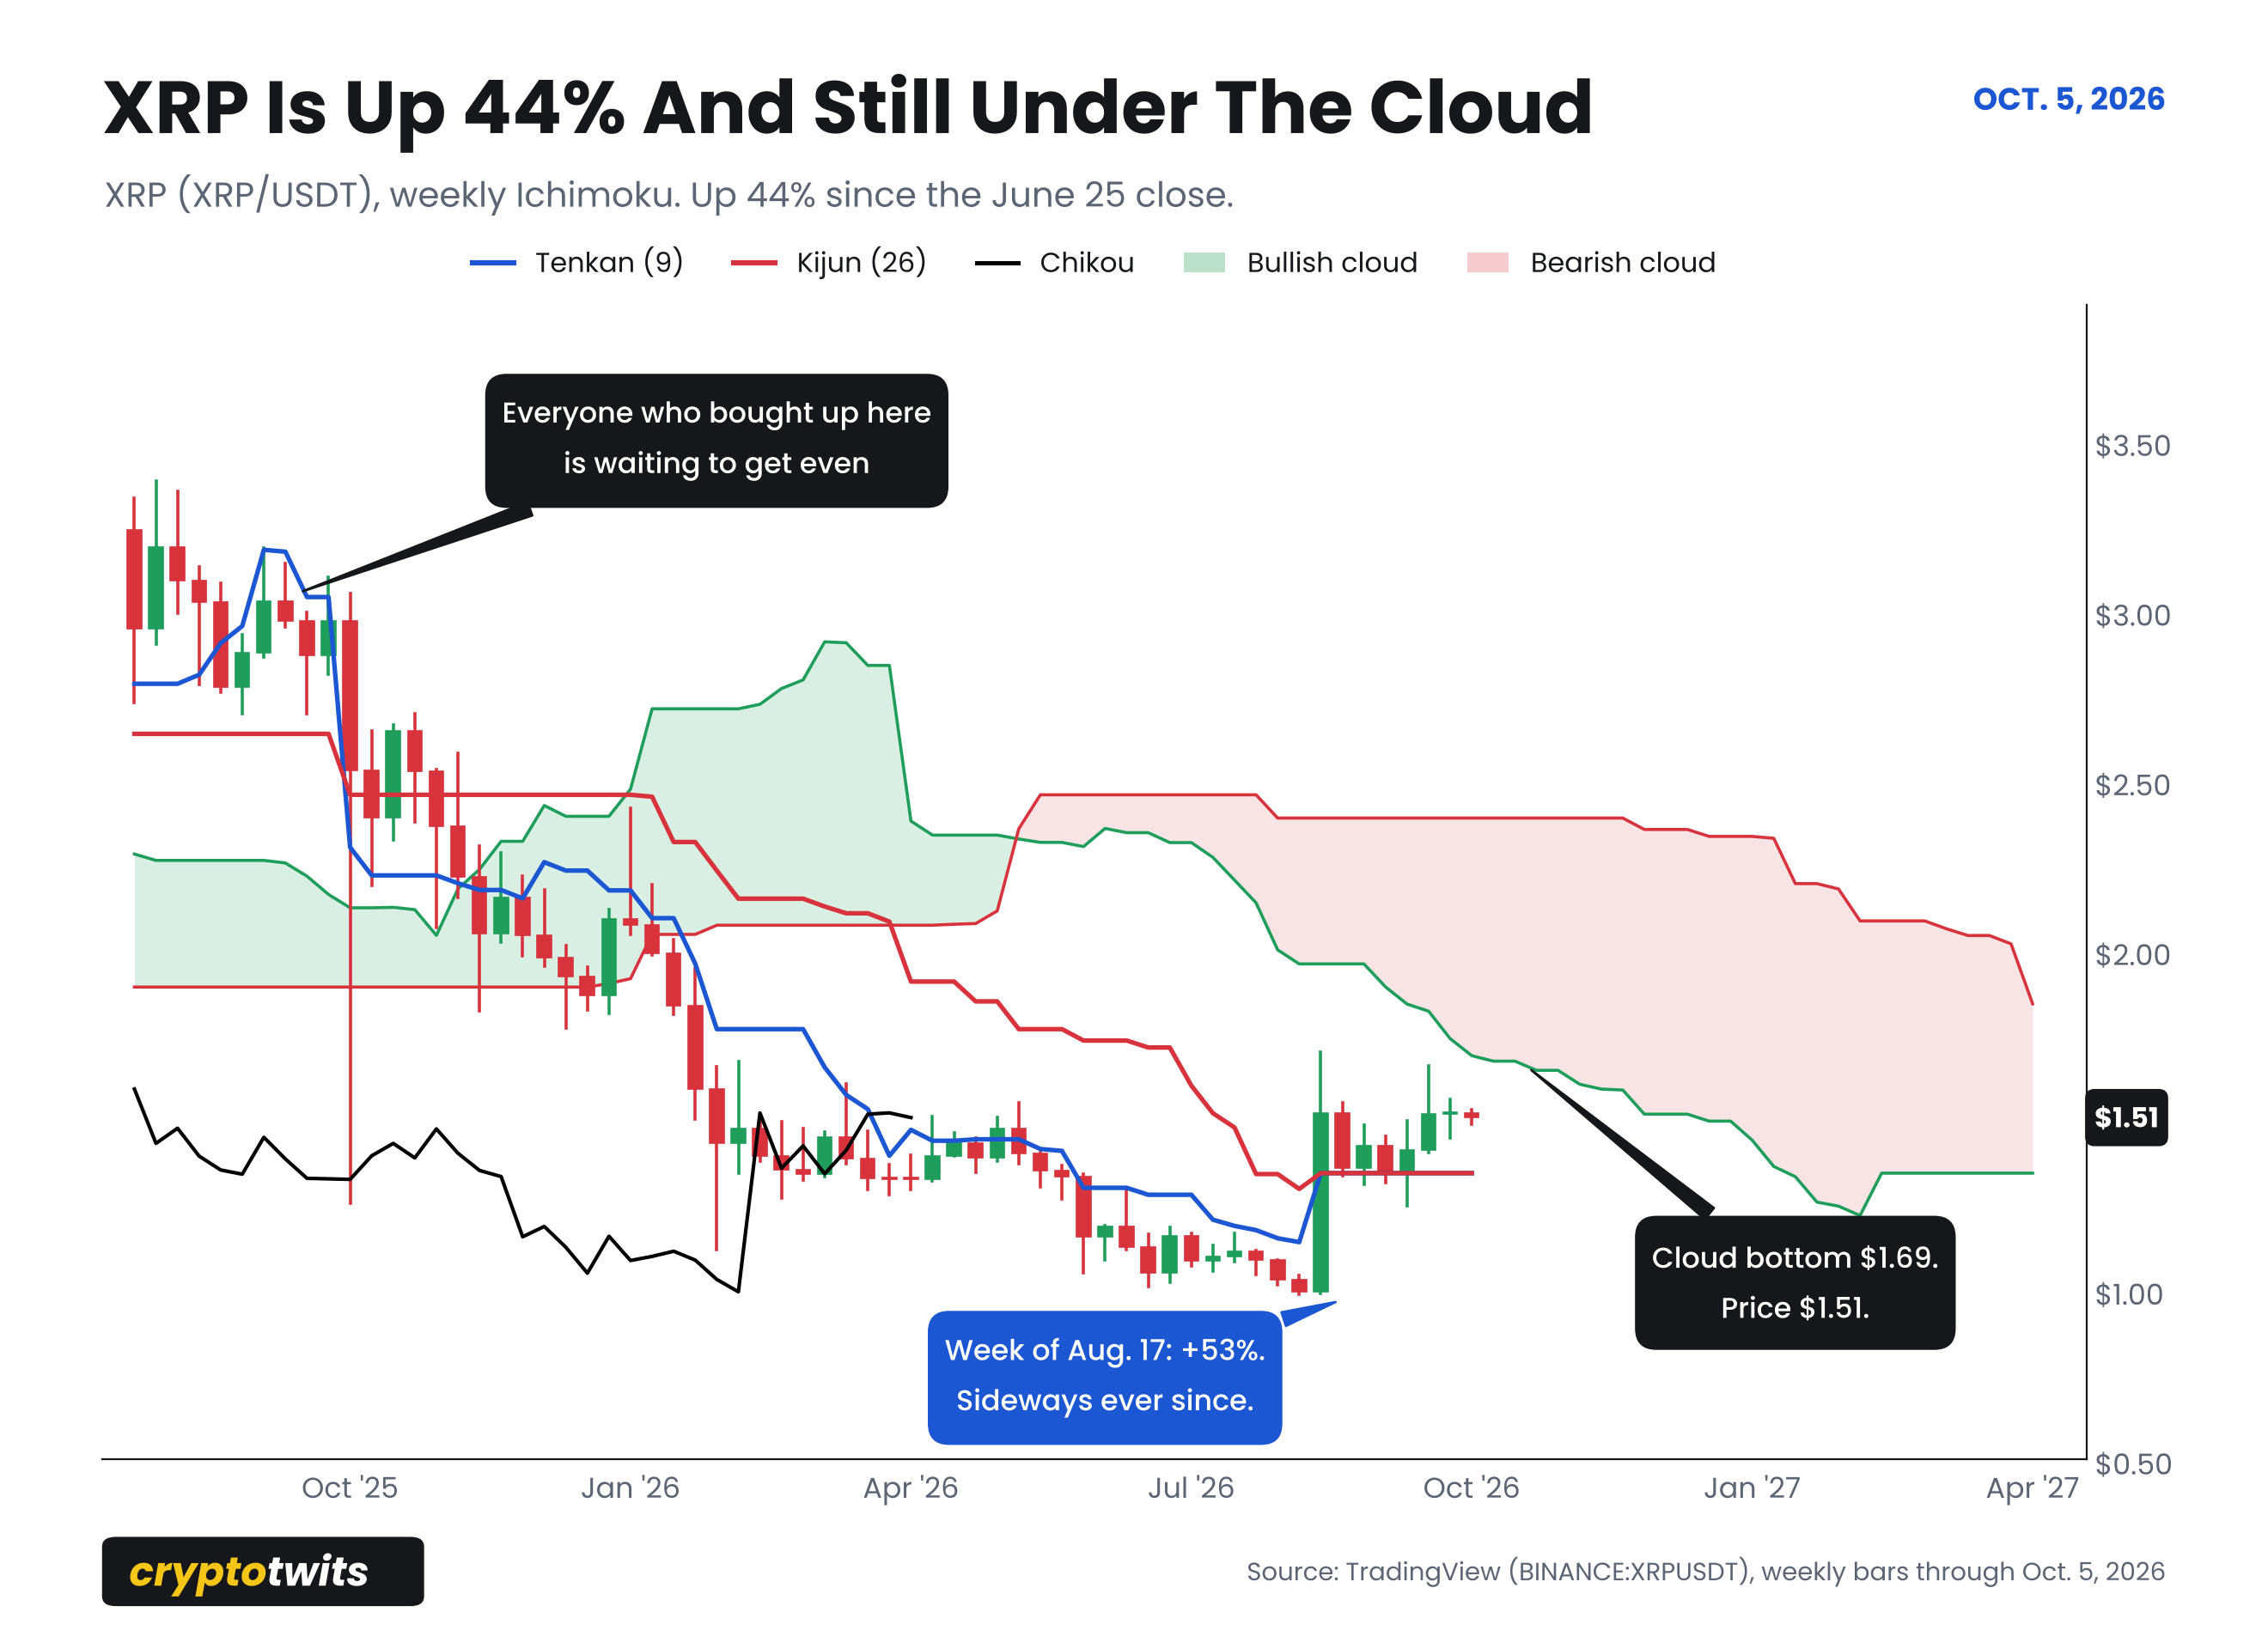
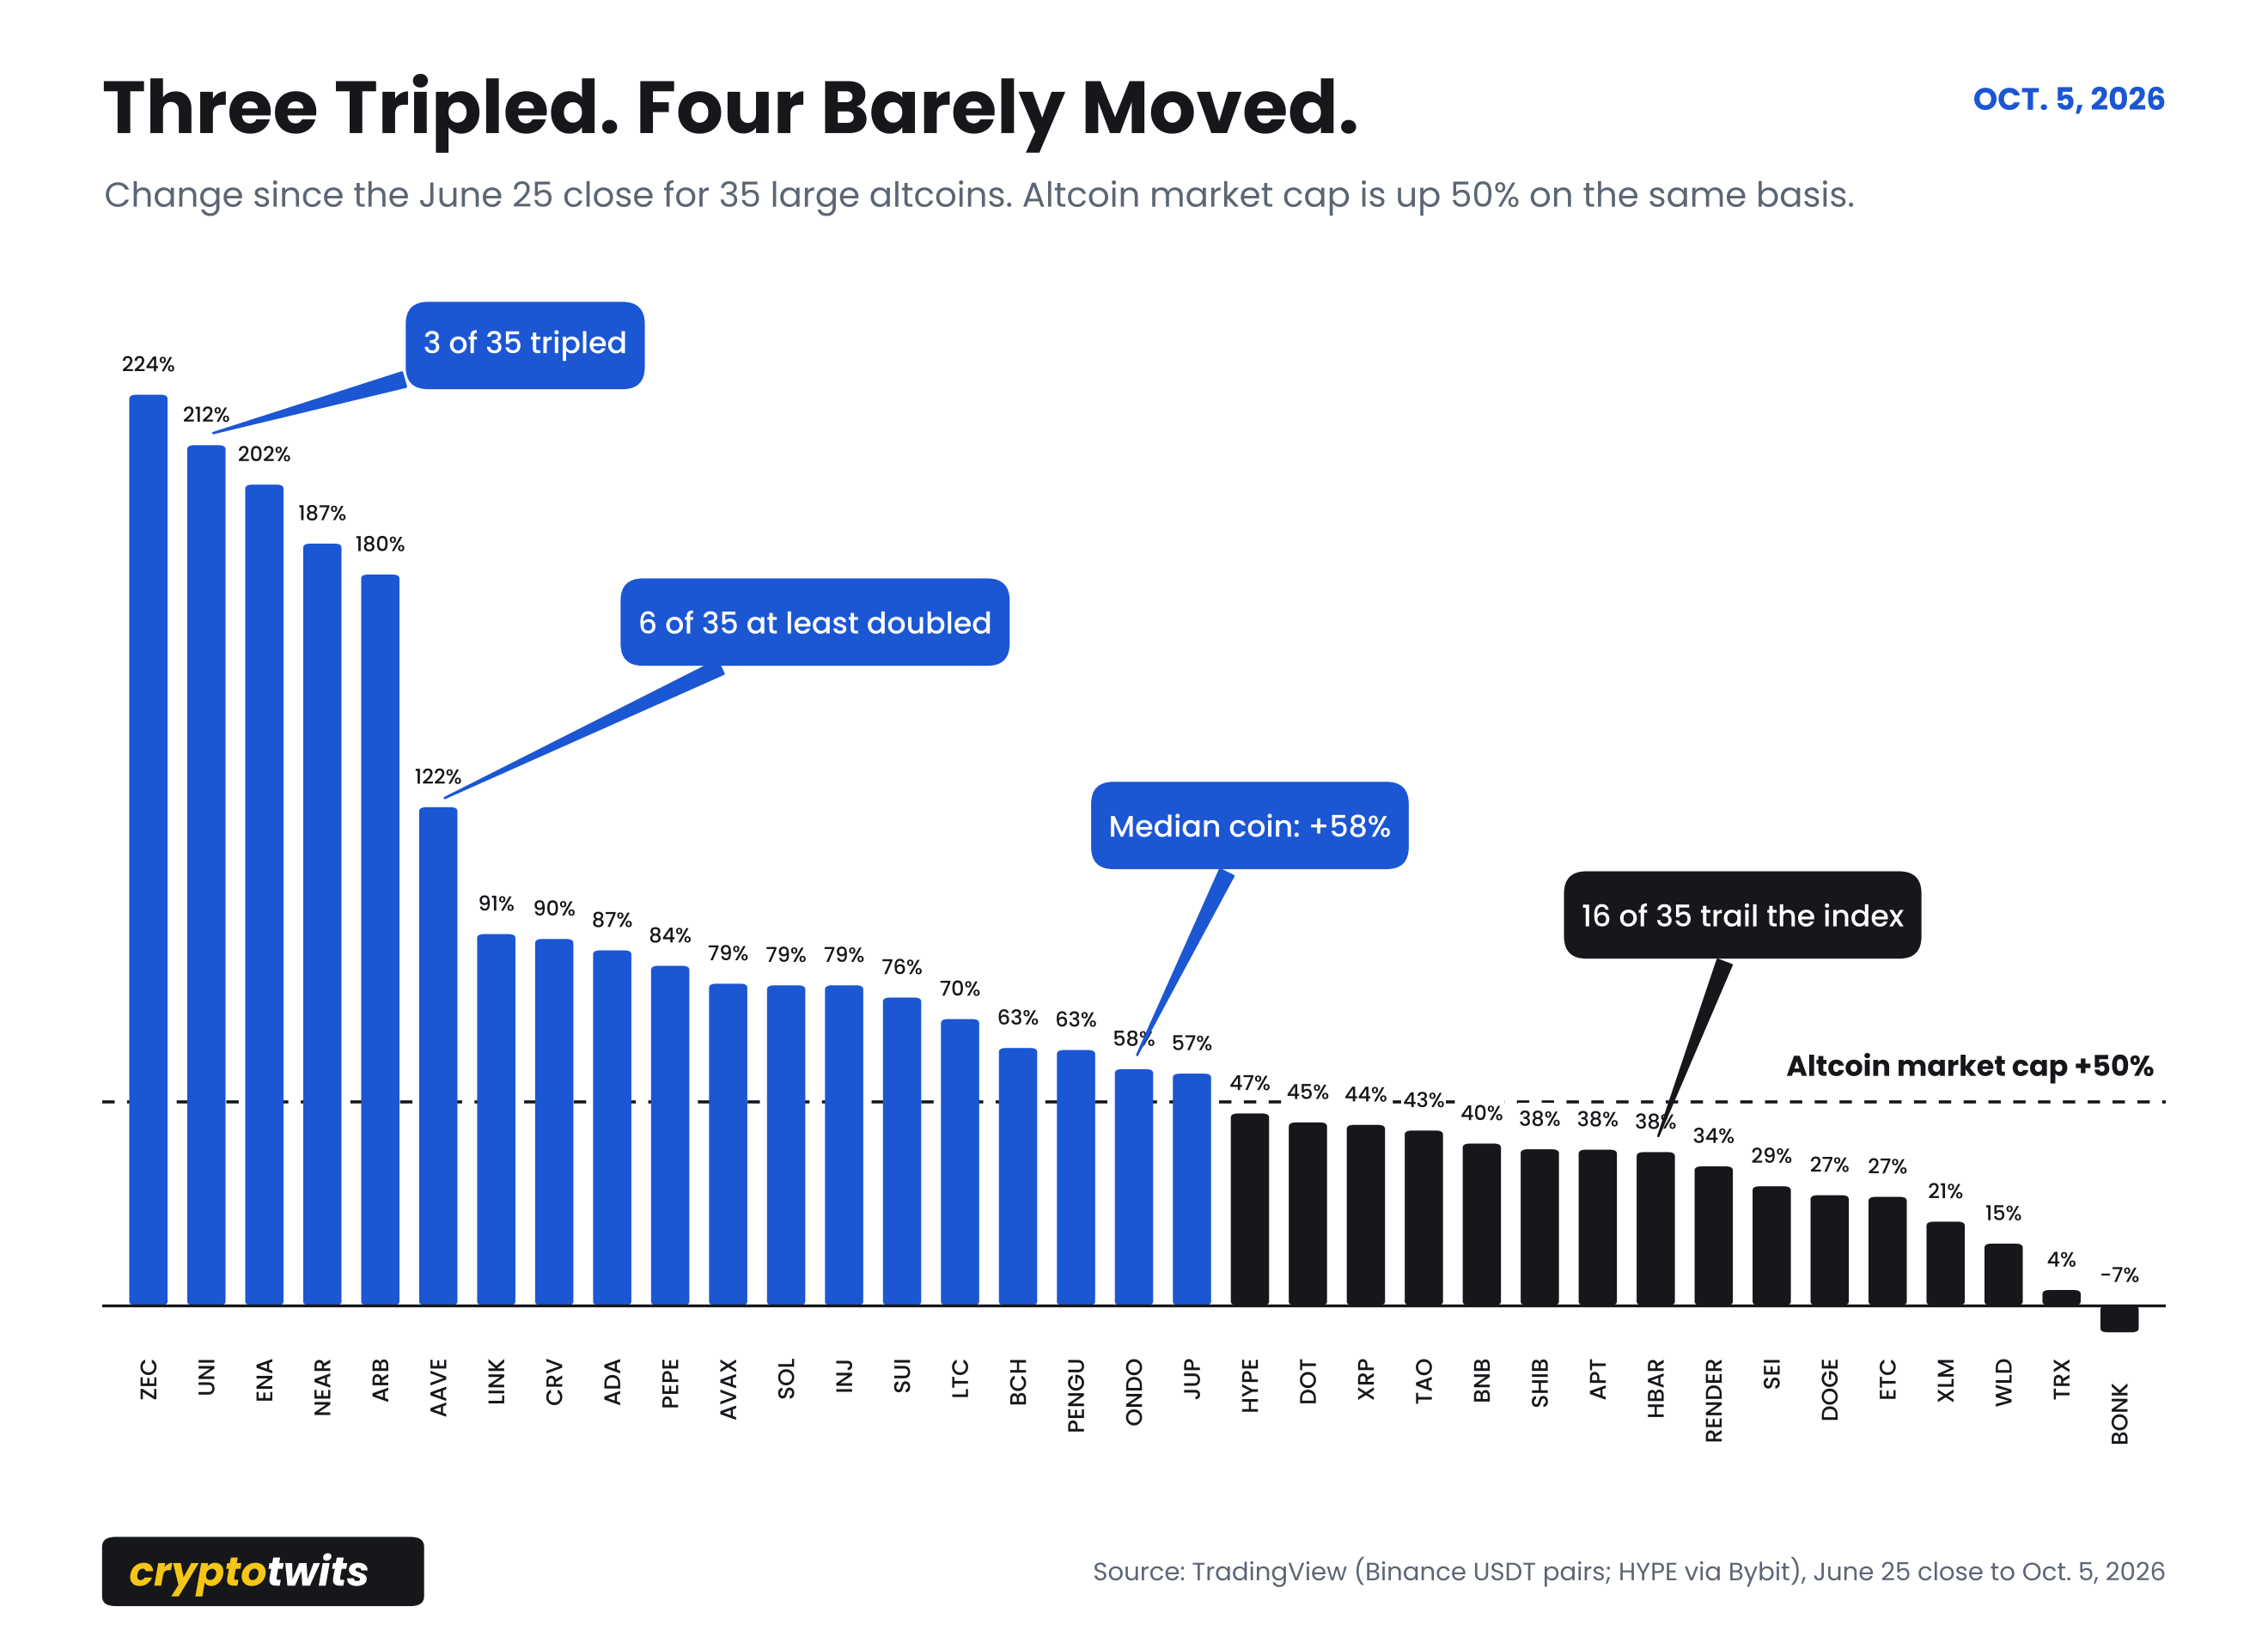
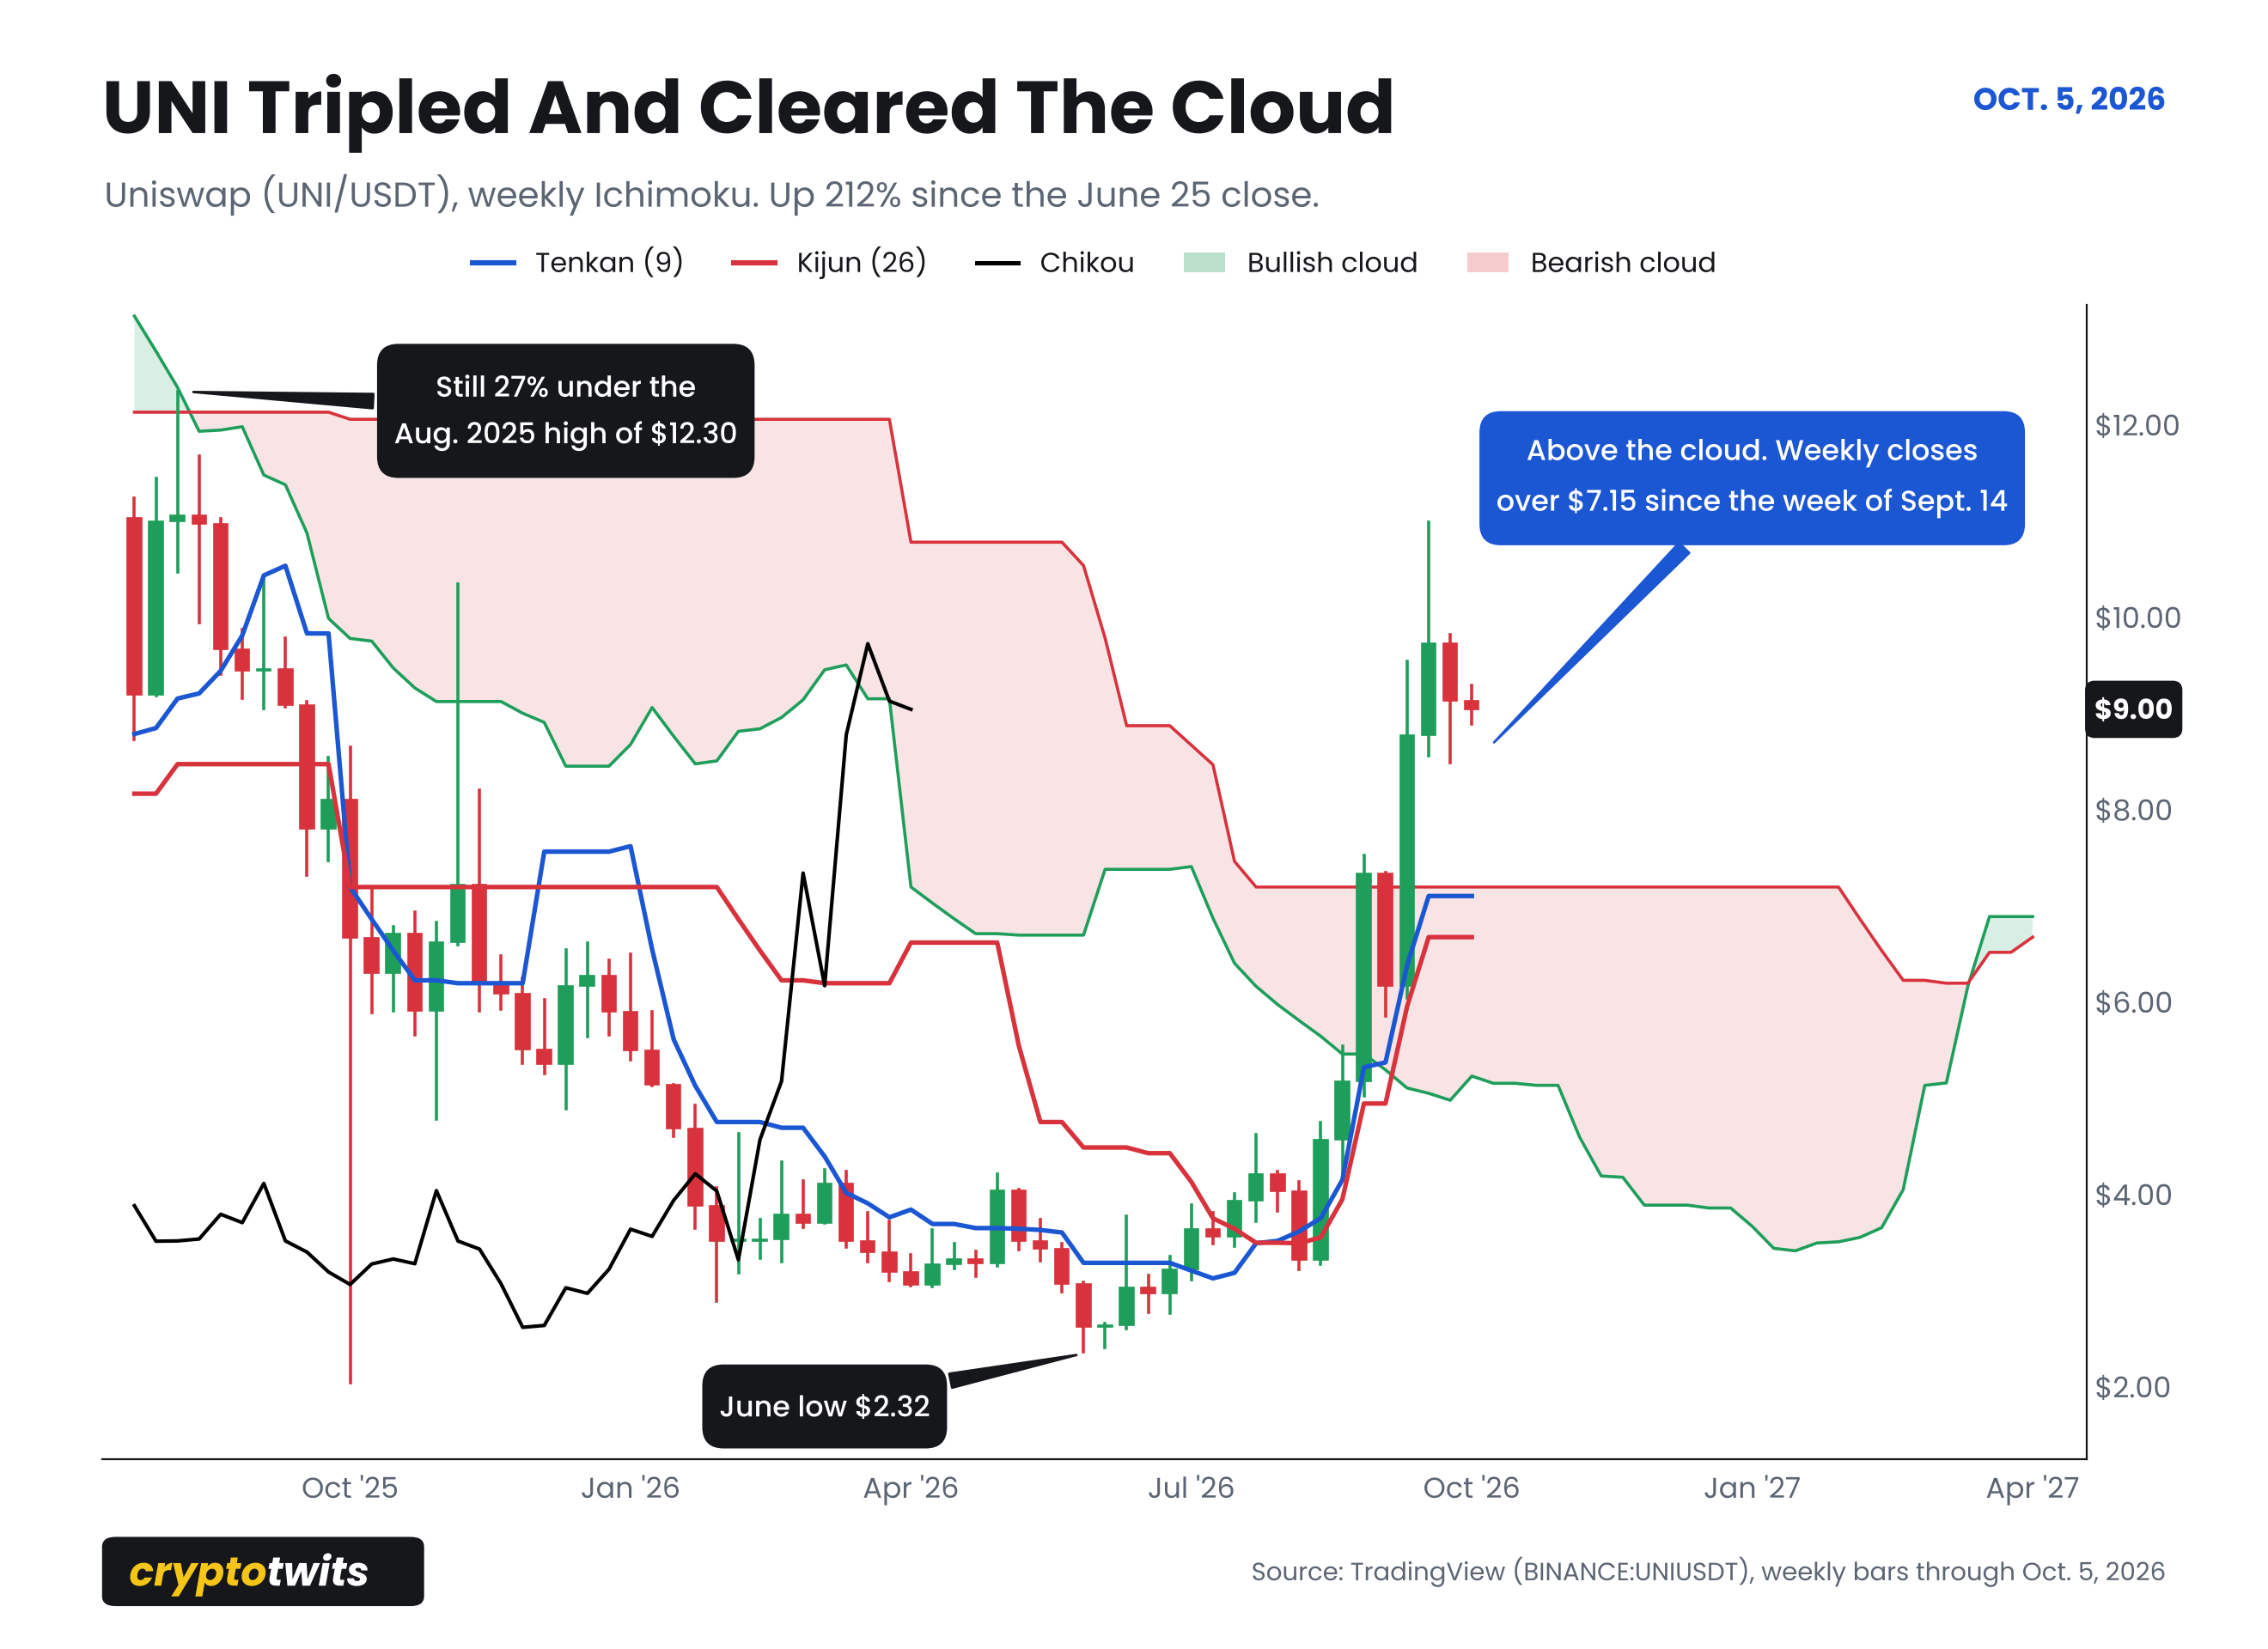
And most bags aren’t the ones tripling. Of 35 big alts I checked, three have tripled since the June 25 close and six have at least doubled. Sixteen are trailing the index. XRP, the one half of retail is holding, is up 44% and still under its weekly cloud. Sitting in a bull run watching other people’s ticker have it is its own kind of miserable.
And a ticker tripling inside this market is Jared Allen in 2011. Twenty-two sacks, half a sack off the record, for a team that went 3-13. 😩
Click to enlarge.
Click to enlarge.
ALTCOINS
What Would Make It Stop Feeling I’m Going To Get Hurt Again 🛑
Levels, mostly. 🤷
This current run has already done one thing the spring version never managed. On Sept. 18 it cleared the May high at $490 billion. That’s the first time since the top that a rally has beaten the peak of the rally before it. That counts for something.
Next is $572 billion. After that comes the halfway-back mark at $634 billion, which sits just under the January 2026 high of $641 billion. That January high was the last failed rally before the floor gave out. Take it back and the “it always ends the same way” crowd has a harder argument to make.
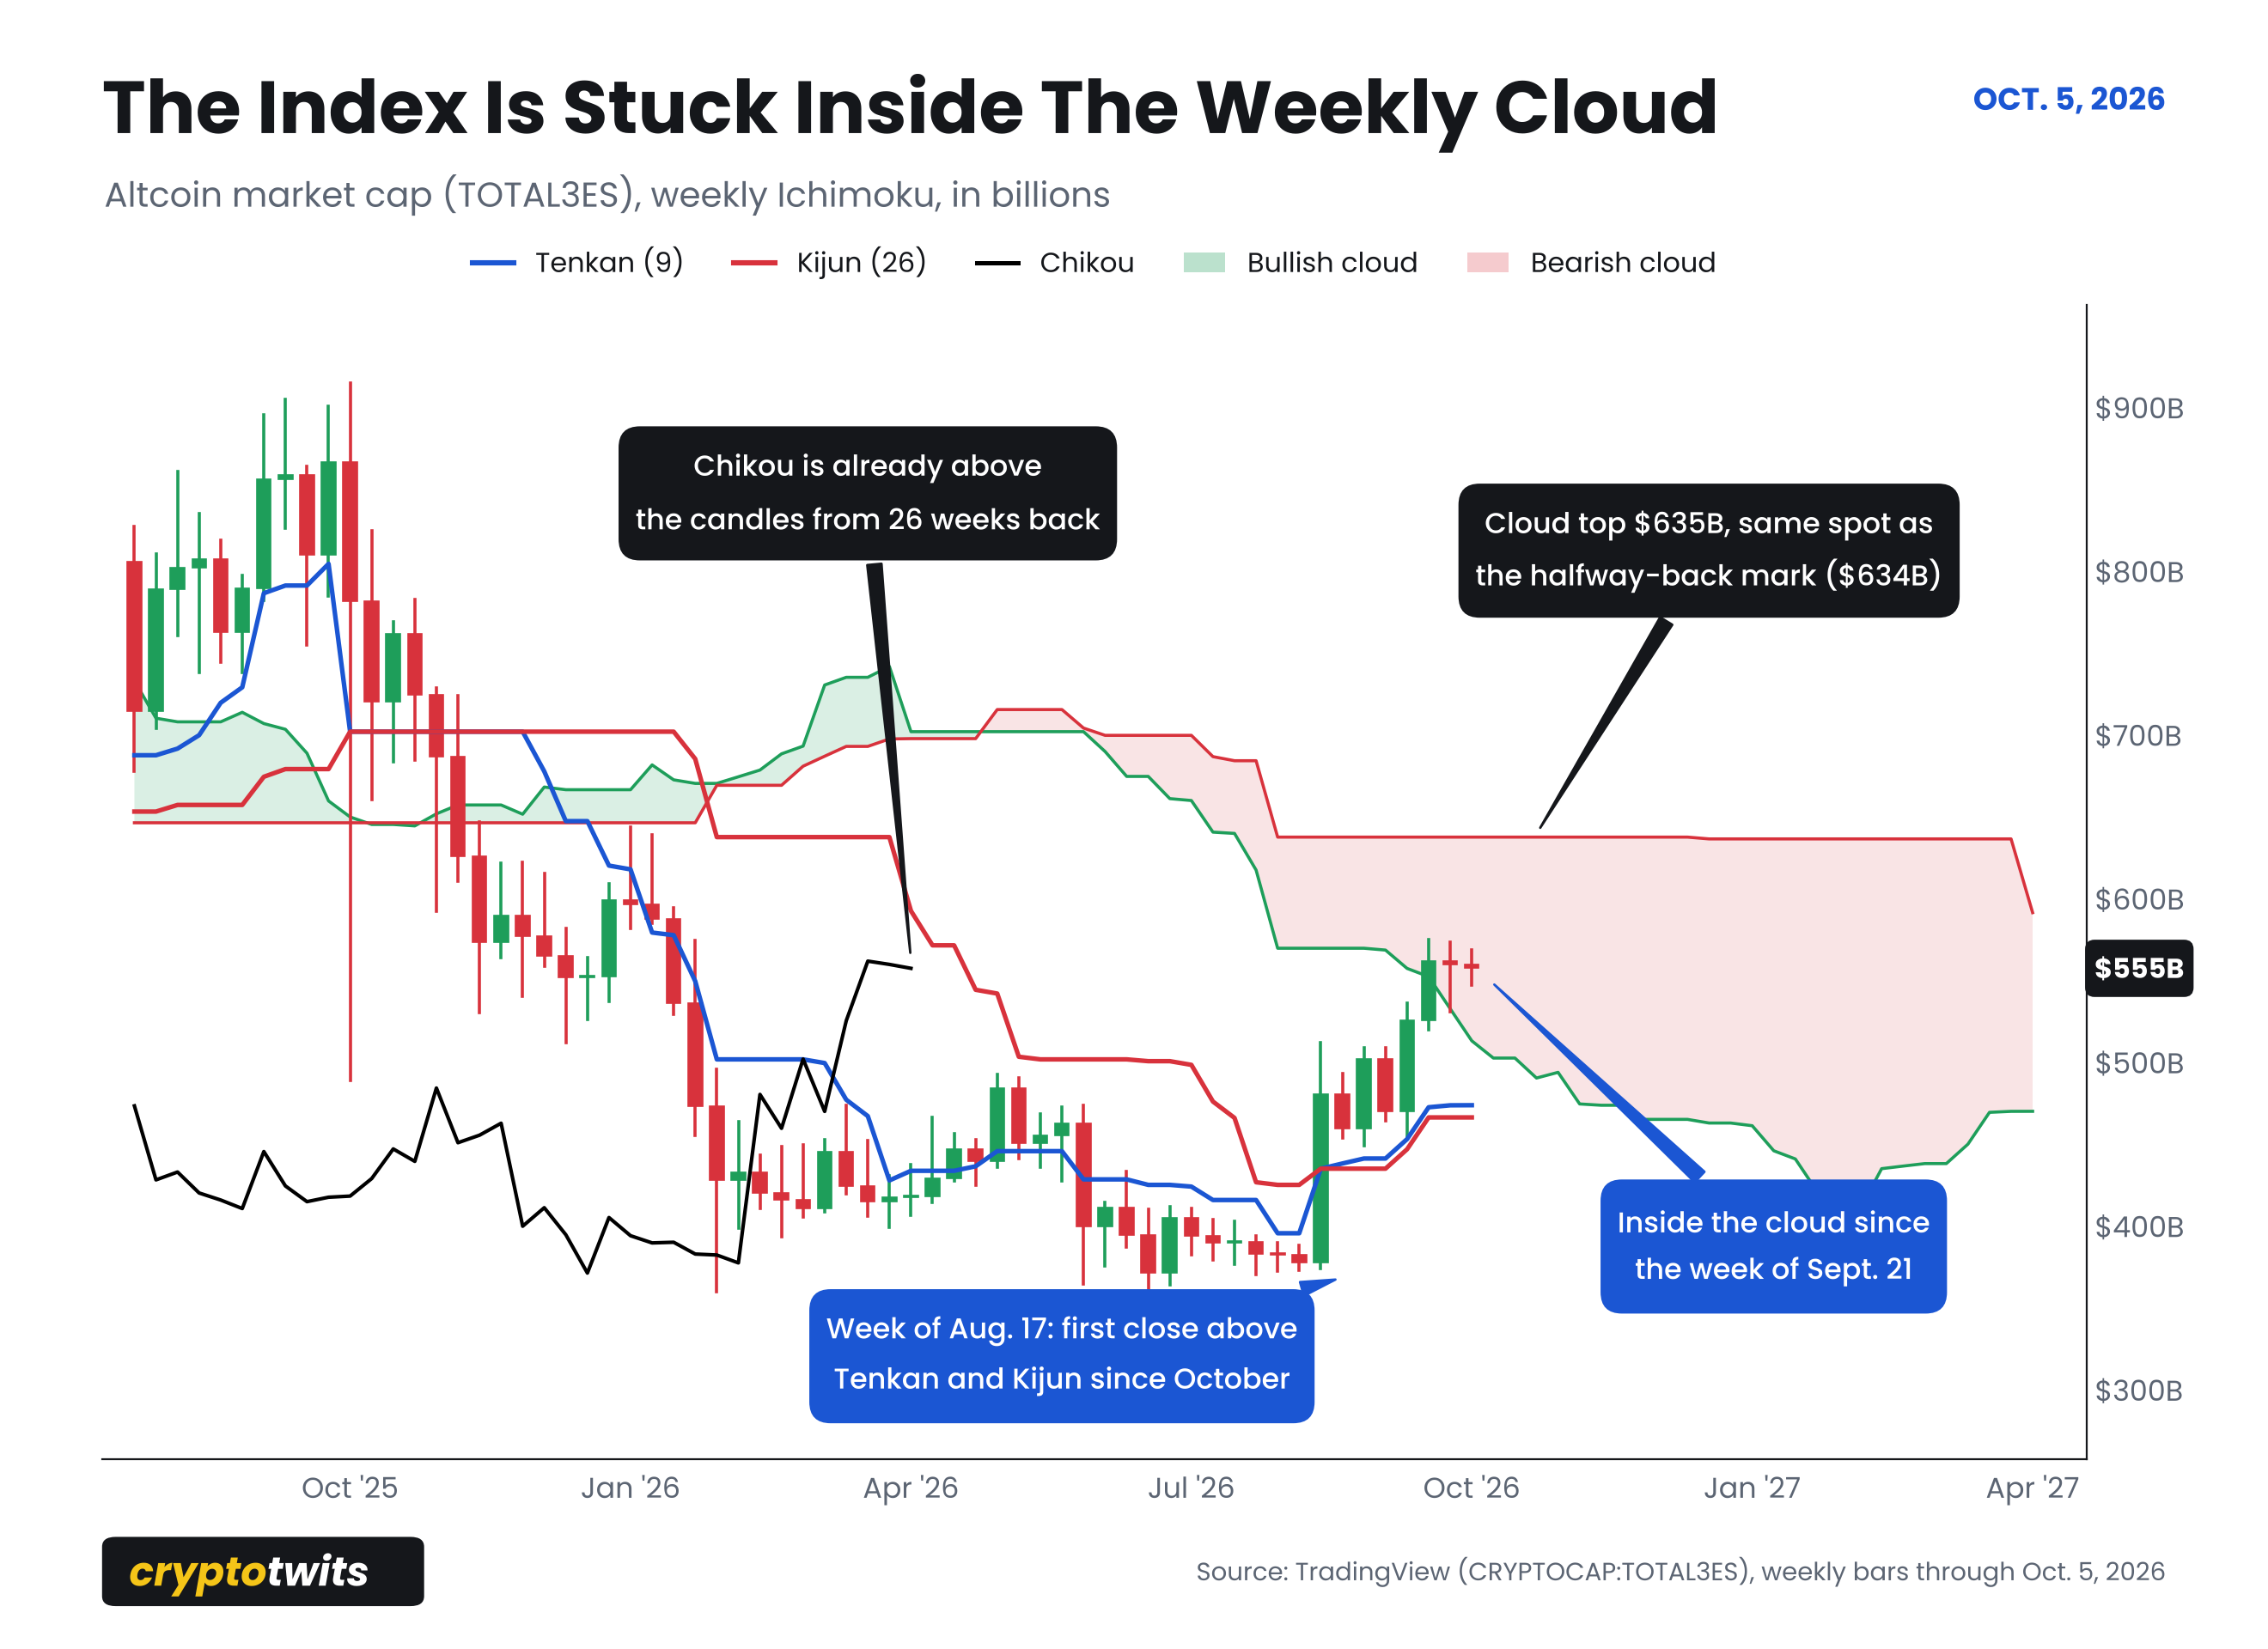
The weekly Ichimoku agrees. The index has been inside the cloud since the week of Sept. 21, and the top of that cloud is $635 billion. Same spot as the halfway-back mark. Inside the cloud is the no-trade zone, which is about how this feels. ☁️
Click to enlarge.
On the downside, the tell is that same $490 billion. Lose the old May high and this starts looking like spring with extra steps.
The calendar isn’t helping anyone sleep, either. Wednesday is one year from the Oct. 7 top. Saturday is one year from the Oct. 10 candle. And if the recovery keeps matching the decline day for day, the index gets back to $912 billion around the middle of March 2027.
The Vikings will have been eliminated by then. Probably in a way nobody’s seen before. 🏈
Get In Touch 📬
Email me, Jonathan Morgan, feedback; I’d love to hear from you. 📧
Follow me on Stocktwits 🫂 And Sponsor this newsletter 😎
|
Get the app Real-time alerts, live earnings calls, your personalised feed - the best experience is on mobile.
|


Terms & Conditions 📝
Securities Disclaimer: STOCKTWITS IS NOT A TAX ADVISOR, BROKER, FINANCIAL ADVISOR OR INVESTMENT ADVISOR. THE SERVICE IS NOT INTENDED TO PROVIDE TAX, LEGAL, FINANCIAL OR INVESTMENT ADVICE, AND NOTHING ON THE SERVICE SHOULD BE CONSTRUED AS AN OFFER TO SELL, A SOLICITATION OF AN OFFER TO BUY, OR A RECOMMENDATION FOR ANY SECURITY. Trading in such securities can result in immediate and substantial losses of the capital invested. You should only invest risk capital, and not capital required for other purposes. You alone are solely responsible for determining whether any investment, security or strategy, or any other product or service, is appropriate or suitable for you based on your investment objectives and personal and financial situation. You should also consult an attorney or tax professional regarding your specific legal or tax situation. The Content is to be used for informational and entertainment purposes only and the Service does not provide investment advice for any individual. Stocktwits, its affiliates and partners specifically disclaim any and all liability or loss arising out of any action taken in reliance on Content, including but not limited to market value or other loss on the sale or purchase of any company, property, product, service, security, instrument, or any other matter. You understand that an investment in any security is subject to a number of risks, and that discussions of any security published on the Service will not contain a list or description of relevant risk factors. In addition, please note that some of the stocks about which Content is published on the Service have a low market capitalization and/or insufficient public float. Such stocks are subject to more risk than stocks of larger companies, including greater volatility, lower liquidity and less publicly available information. Read the full terms & conditions here. 🔍
Author Disclosure: The author of this newsletter holds positions in AVAX, ADA, PUDGY, WLD, NEAR, INJ, LTC, LINK, ZEC, XLM, and FET. 📋